How it works
The principle of moodix market
sentiment measurement
Moodix measurement is based on the thesis that most major market movements and trend changes in financial markets are the result of the impact of some of the endless stream of chaotically emerging news. So-called “breaking news”. This news aggregate to create positive or negative pressure and define the sentiment of global financial markets.
On average, moodix systems record 3,000 market-relevant news items per day. Only about 1% of these are truly breaking news. We identify them, sort them out and most importantly, measure the impact of this news on the markets and calculate various moodix indices and indicators from them.
Where do we measure the market sentiment?
The moodix measurement takes place in the most liquid ES futures market, the SP500 index futures contract. This market is liquid enough even for the biggest market players and is open almost all day (23 hours/day), which is crucial for measuring the impact of fundamentals on markets. This is because news comes out throughout the day and to measure it, you need an instrument that is open as long as possible (hence, e.g. stocks or options are not suitable for measurement).
.

Big market players use ES to quickly rebalance portfolios, hedge or just for market speculation. To give you an idea: One ES futures contract (SP500) is 50x the current value of the SP500 index. The average liquidity traded in 1 min is about 1000 contracts. That’s roughly $250 million per minute. Therefore, big players with billions of dollars on their accounts can easily execute in this market. Due to the presence of big players, there is unprecedented competition among market makers in the ES market.
This makes ES very sensitive to any incoming news. Market makers have to react very quickly (within milliseconds) to all incoming news. However, this news comes out chaotically and even market makers cannot prepare for it (except for macro news that come out at fixed times). This is their main drawback, which we try to use to our advantage when it comes to moodix measurements. Their consensus (called GAP) upon each important piece of news is valuable information for us. We measure these GAPs and create a market sentiment index from them.
Identification of breaking news and measurement of strength of market reaction
Once we identify the market movement on the ES (SP500) that is most likely to have occurred as a result of the market reaction to the news, we analyze the news released at that time. On average, 3-4 news items are released every minute. During the EU and US sessions, there can be dozens of pieces of news per minute. If we find that there was a demonstrable market reaction to a particular piece of breaking news, we record it, categorize it and measure the strength of the market reaction to it.
News measurement
Market reactions to similar pieces of news vary over time and according to the evolution of the context. At certain times, rising inflation is good news for markets (as markets can react positively), while at other times, rising inflation is unwelcome and markets react negatively to the news. Similarly, in a certain context, employment growth is positive for markets, in another context it is negative (e.g. due to the Fed’s expectations).
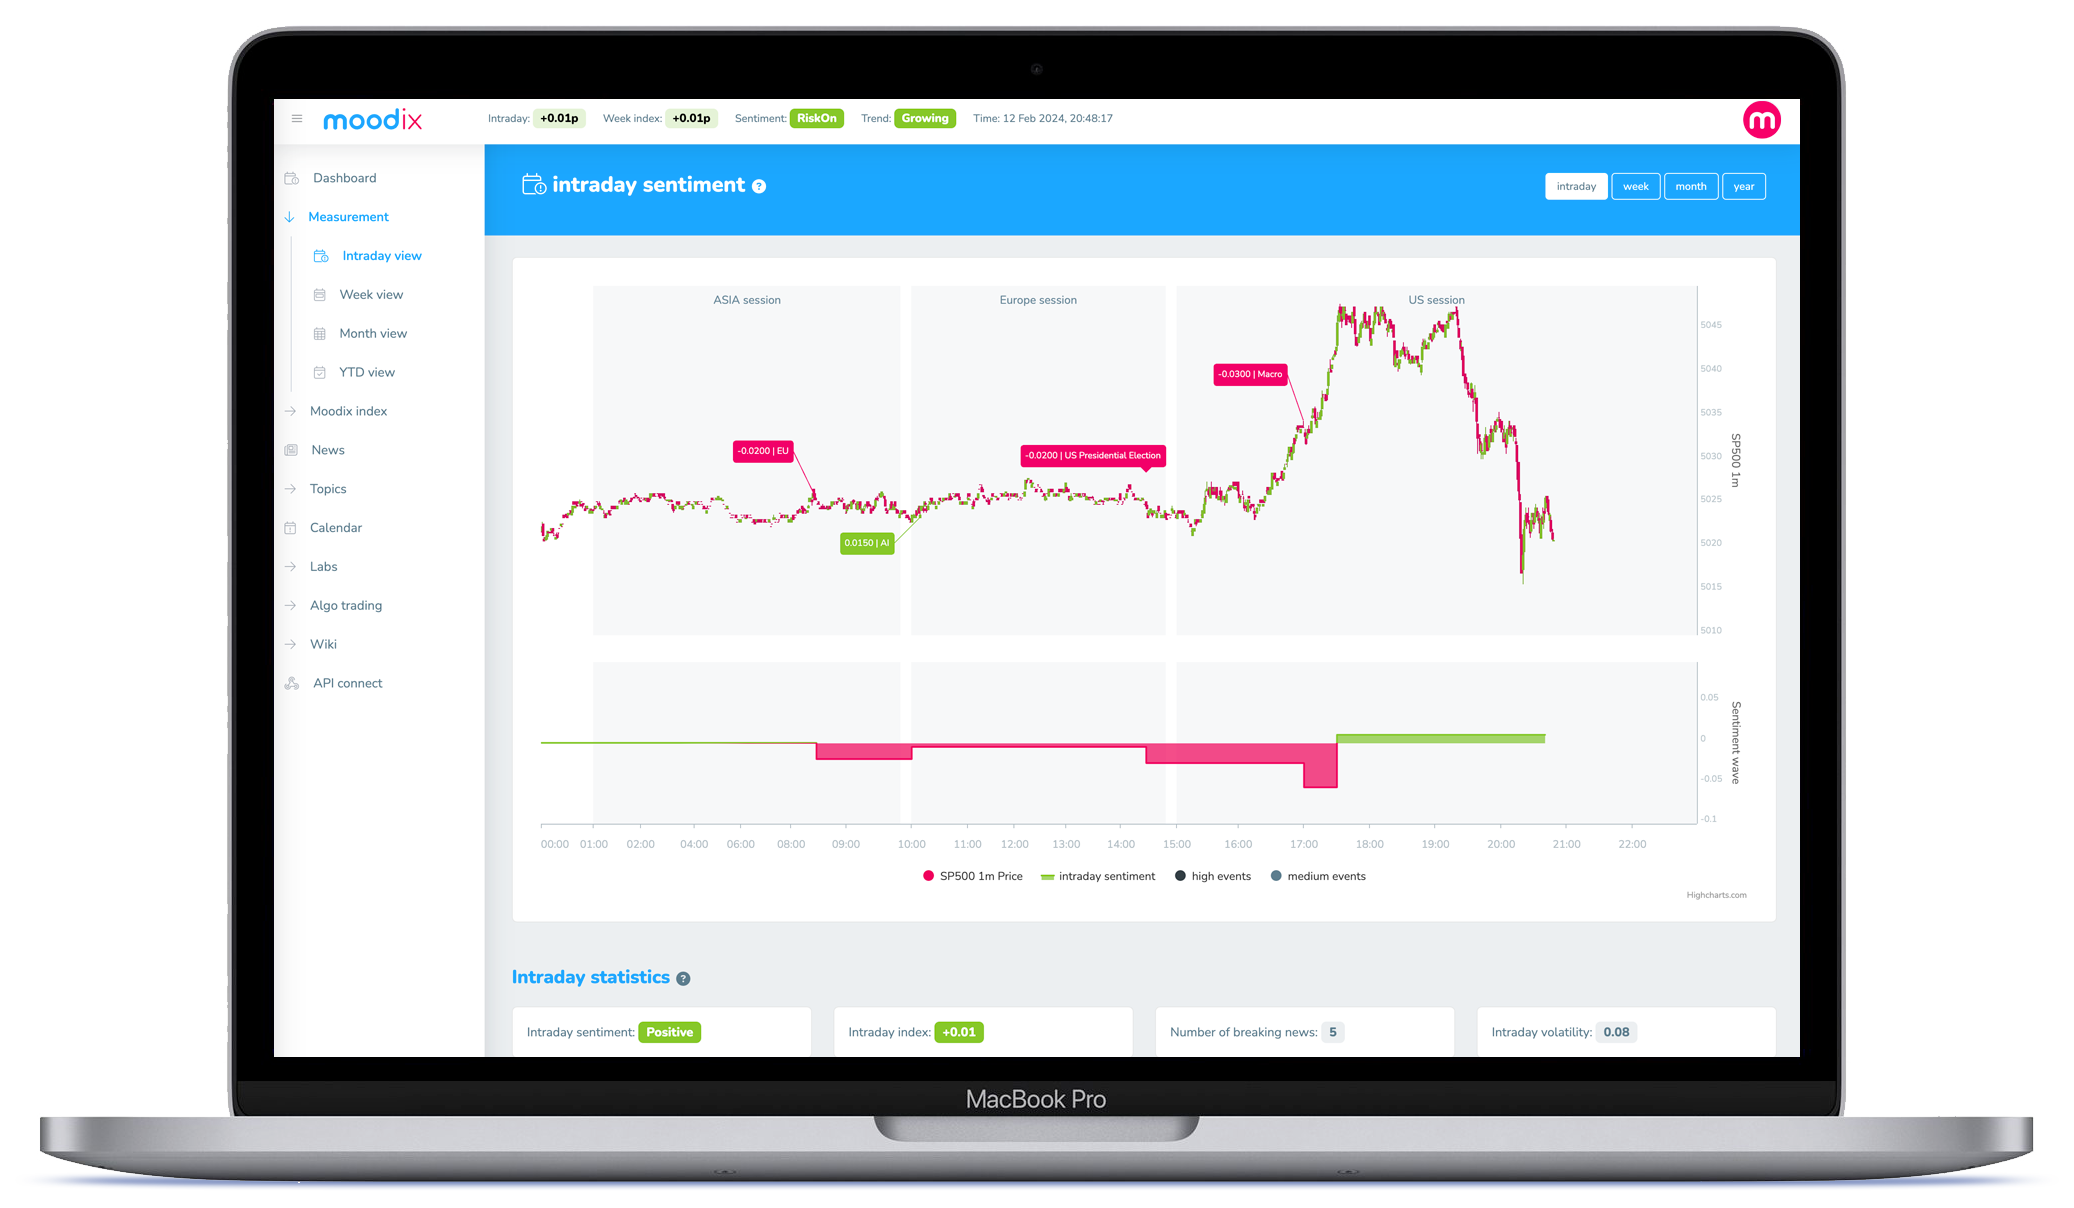
If the market reacts to the news, we measure the strength of the reaction and store it in our database for the relevant topic. We then publish the result of each news measurement on the moodix web app and on the social networks.

Upon being measured, each piece of breaking news you are informed about consist of: 1. the time the breaking news was released – 2. the breaking news itself – 3. strength and direction of market reaction – 4. the topic of the news
Market’s memory
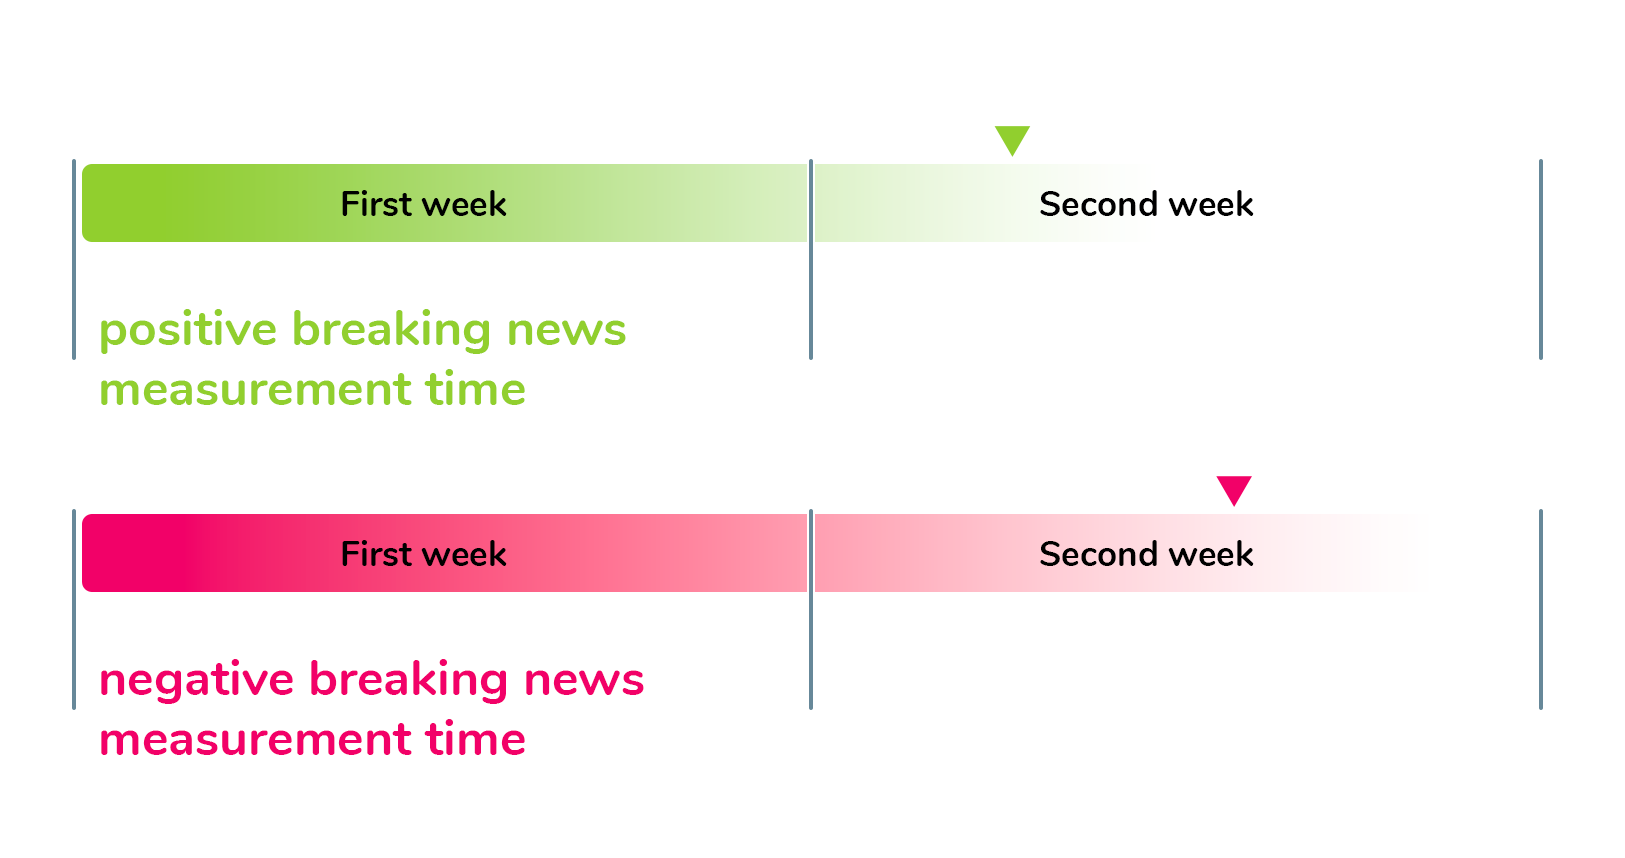
Any positive or negative breaking news only affects the market for a certain period of time. Unless the news or the entire topic to which the news belongs has further major developments, the market tends to focus on it for a maximum of 10 trading days (2 weeks). Generally spoken – the market tends to absorbs positive breaking news faster than negative news. The vast majority of news is absorbed by the market within one week (5 trading days).
In this context, we can speak of market memory, which is a time frame in which changes in market sentiment take place. Therefore, in sentiment calculations we work with five (MA5) and ten-day moving averages of the intraday values of the Moodix index™.
How do we categorize breaking news?
We categorize all breaking news according to its content into topics. For example, all Fed-related news is stored in the FED topic category. All macro news is stored in the macro topic category, etc.

We further use the measured news sorted by topic. We sort entire topics themselves by the strength of their impact on markets so that we can compare their impact with one another. This approach allows us to see what is really weighing most heavily on the markets. In the past, this has included Covid, the war in Ukraine, Brexit, etc.
The speed of breaking news measurement
Currently, we measure breaking news from 8:00 UTC to 22:00 UTC – which means we measure the entire EU and US sessions live – in real time. The Asian session (23:00 UTC to 07:00 UTC) is always measured retrospectively between 9:00 – 10:00 UTC.

We usually measure the breaking news itself within 3-4 minutes upon it being published). Exceptionally, it happens that we need to analyze the breaking news more thoroughly and find more details to, in such cases it may take us around 10-15 minutes to measure the message. We need to be 100% sure and always perform a detailed analysis if the market reaction is not clear.
When is most breaking news released during trading days?
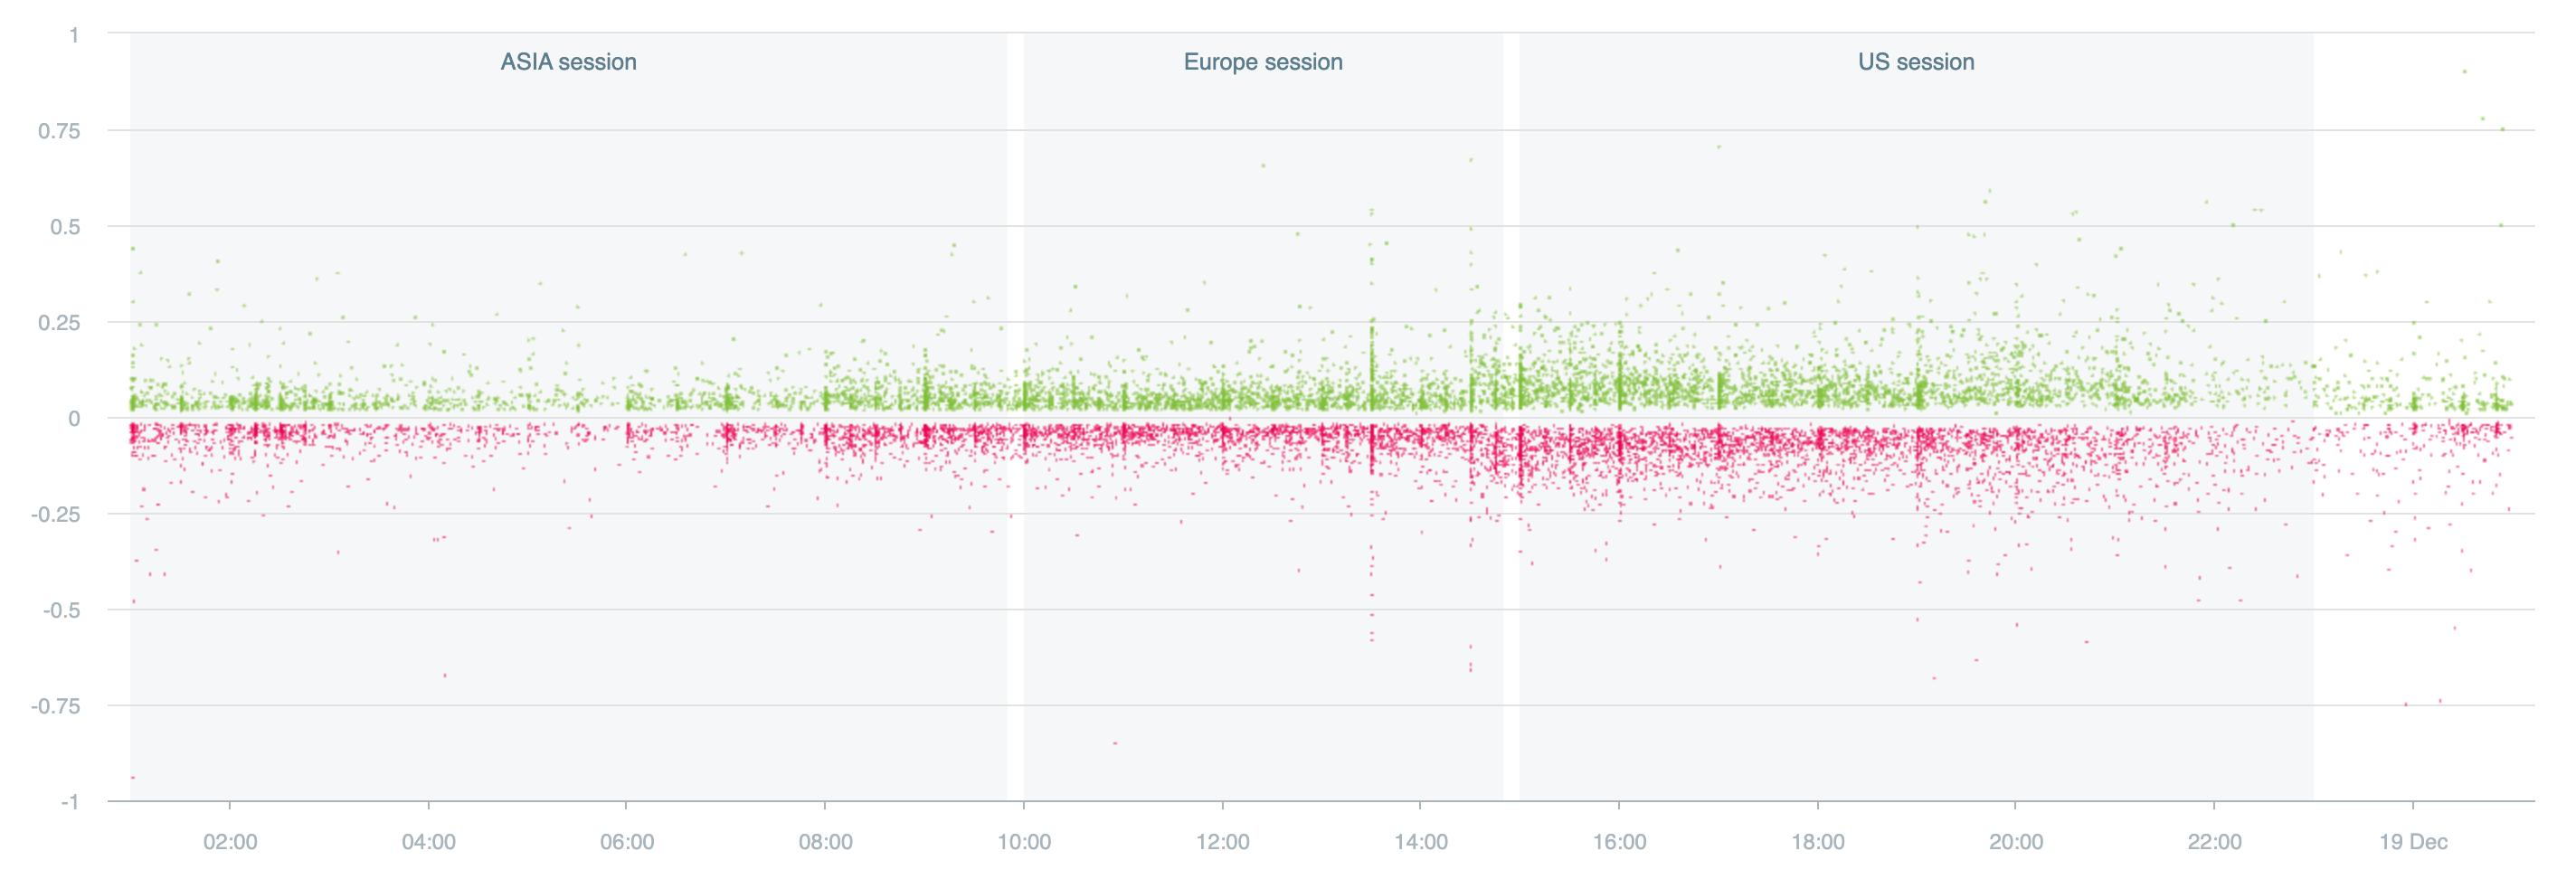
In the app, we give you insight into the times at which most breaking news is released during trading days. This statistic provides interesting insight for those oriented mostly on short-term time frames.
The construction of the Moodix index™ and its meaning
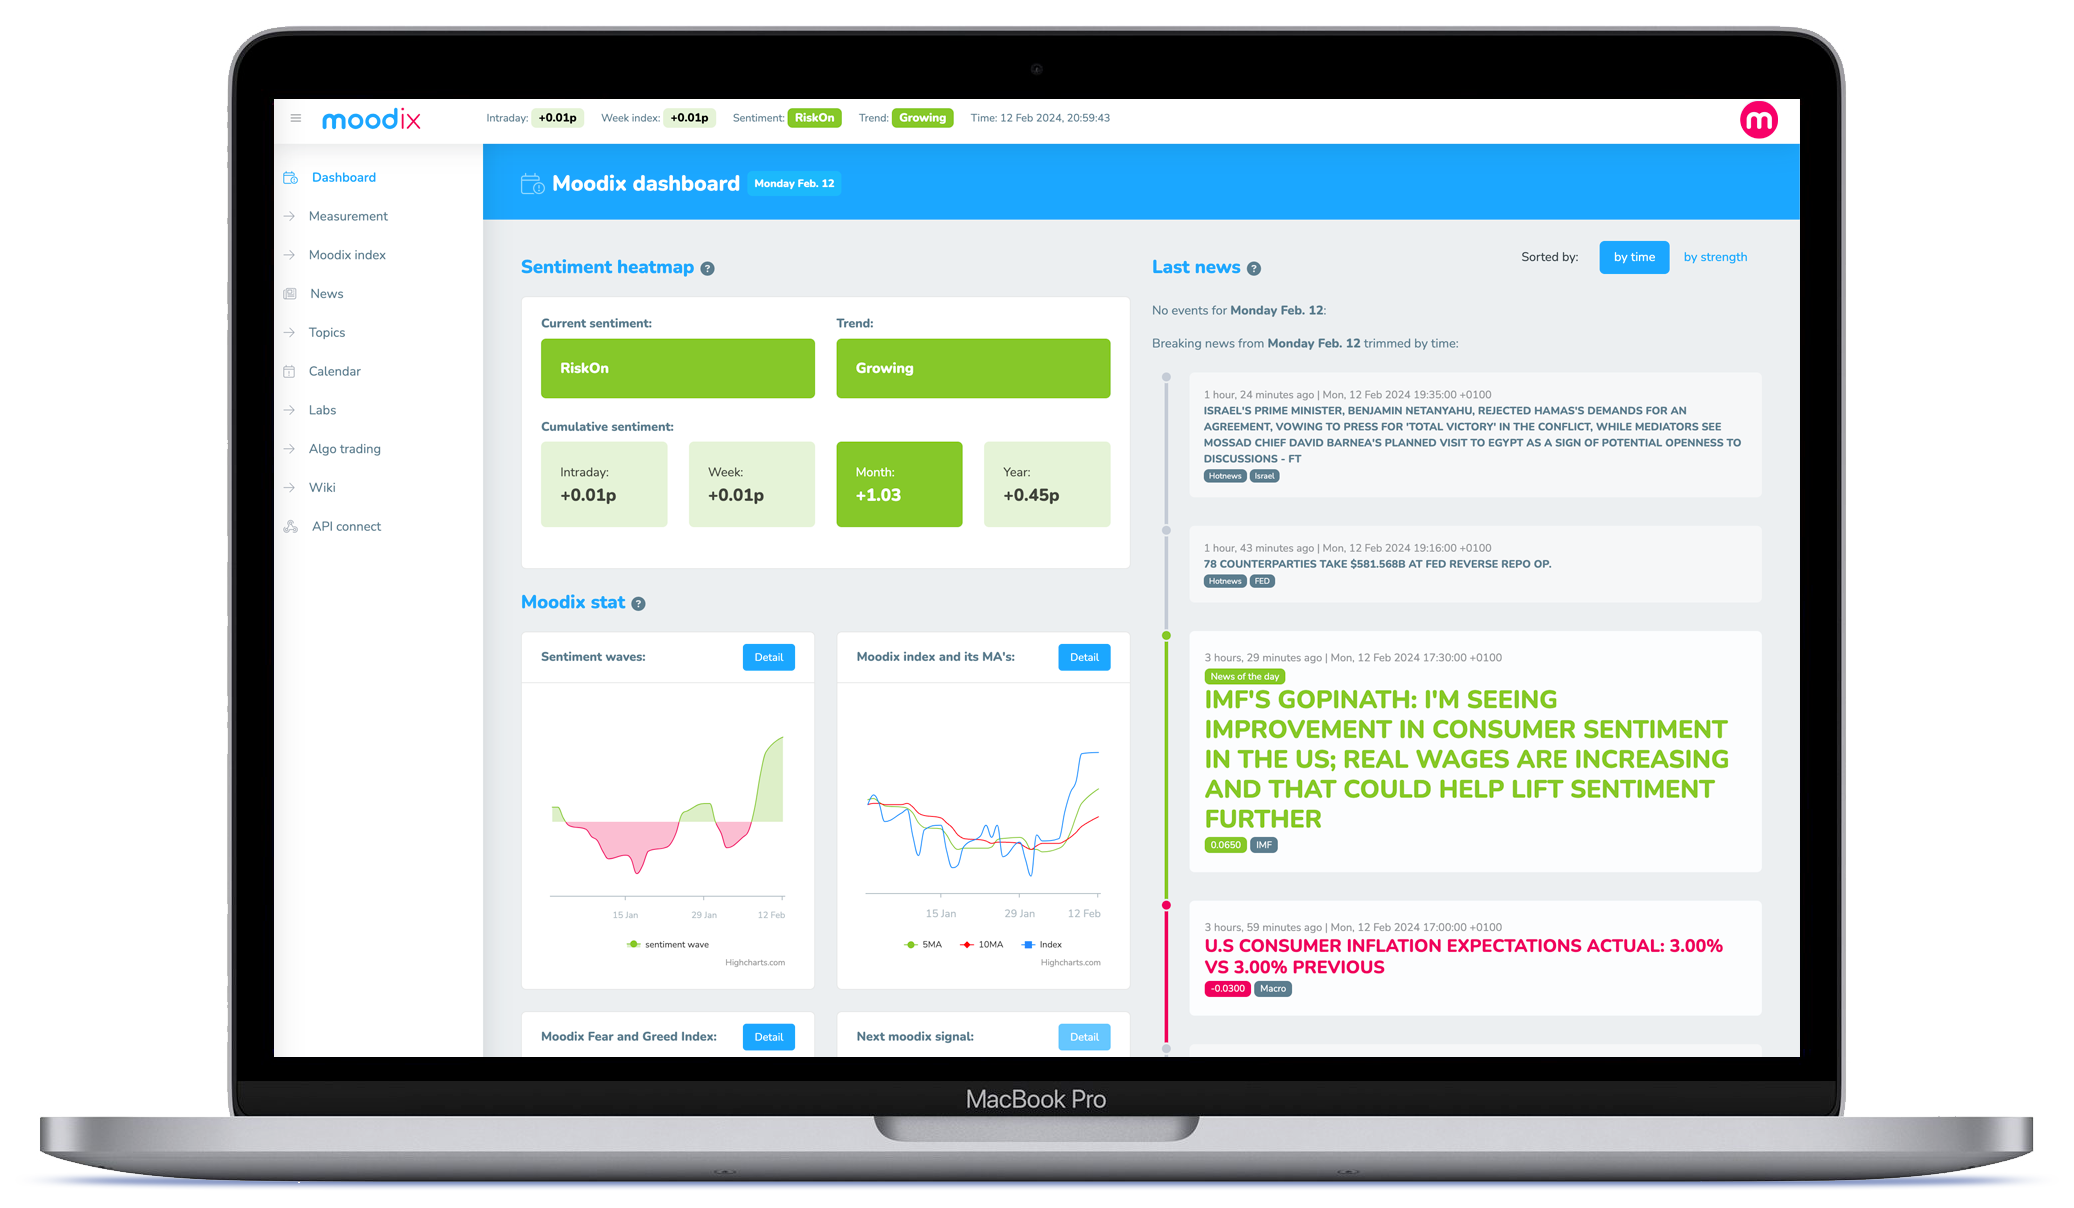
The value of the Moodix Index is the sum of the values of the measured breaking news over a specified time period, i.e. the accumulation of market reactions to breaking news over a specified period of time. It is a quantification of the market’s reaction to fundamentals.
-
The intraday value of the Moodix™ index is the sum of the values of the identified breaking news for the trading day.
-
The weekly Moodix index™ is the sum of the values of the measurements for the trading week.
-
If the intraday value of the Moodix index™ is negative, it means that on a given day the news to which the market reacted negatively prevailed or the negative news for the day was stronger in aggregate than the positive ones. Conversely, a positive intraday Moodix index™ indicates a predominantly positive market reaction to incoming news.
-
This is similar for the weekly, monthly and annual (YTD) values of the Moodix index™.
-
As such, the value of the Moodix index™ from the start of measurement in 2019 to the present day has no practical application, standing at -35p in March 2024.
-
This is partly due to the fact that the market always reacts roughly twice as strong to negative news than to positive news. Moreover, markets have been under intense pressure since 2019 (trade wars, pandemics, war, inflation).
-
The time series of the daily Moodix index™ values and the moving averages of these values are much more important and serve us to describe and understand the dynamics of market sentiment in more detail. See further info on this bellow.
Waves of sentiment RiskOn and RiskOff
Out of the measured Moodix index™, we calculate (according to the aforementioned market memory) five- and ten-day moving averages for 5 (MA5) and 10 (MA10) days. This allows us to see what the average sentiment of the market is at the more distant (MA10) and closer (MA5) boundary of its memory. Their relative position, distance and the difference in their values (MA10 from MA5) then creates Moodix sentiment waves™. If the resulting value is negative, we call this wave RiskOff. If it is positive, we call it RiskOn.
Individual waves last from a few days to a few weeks or months. Read more about how to use them in practice here.
Market sentiment trends
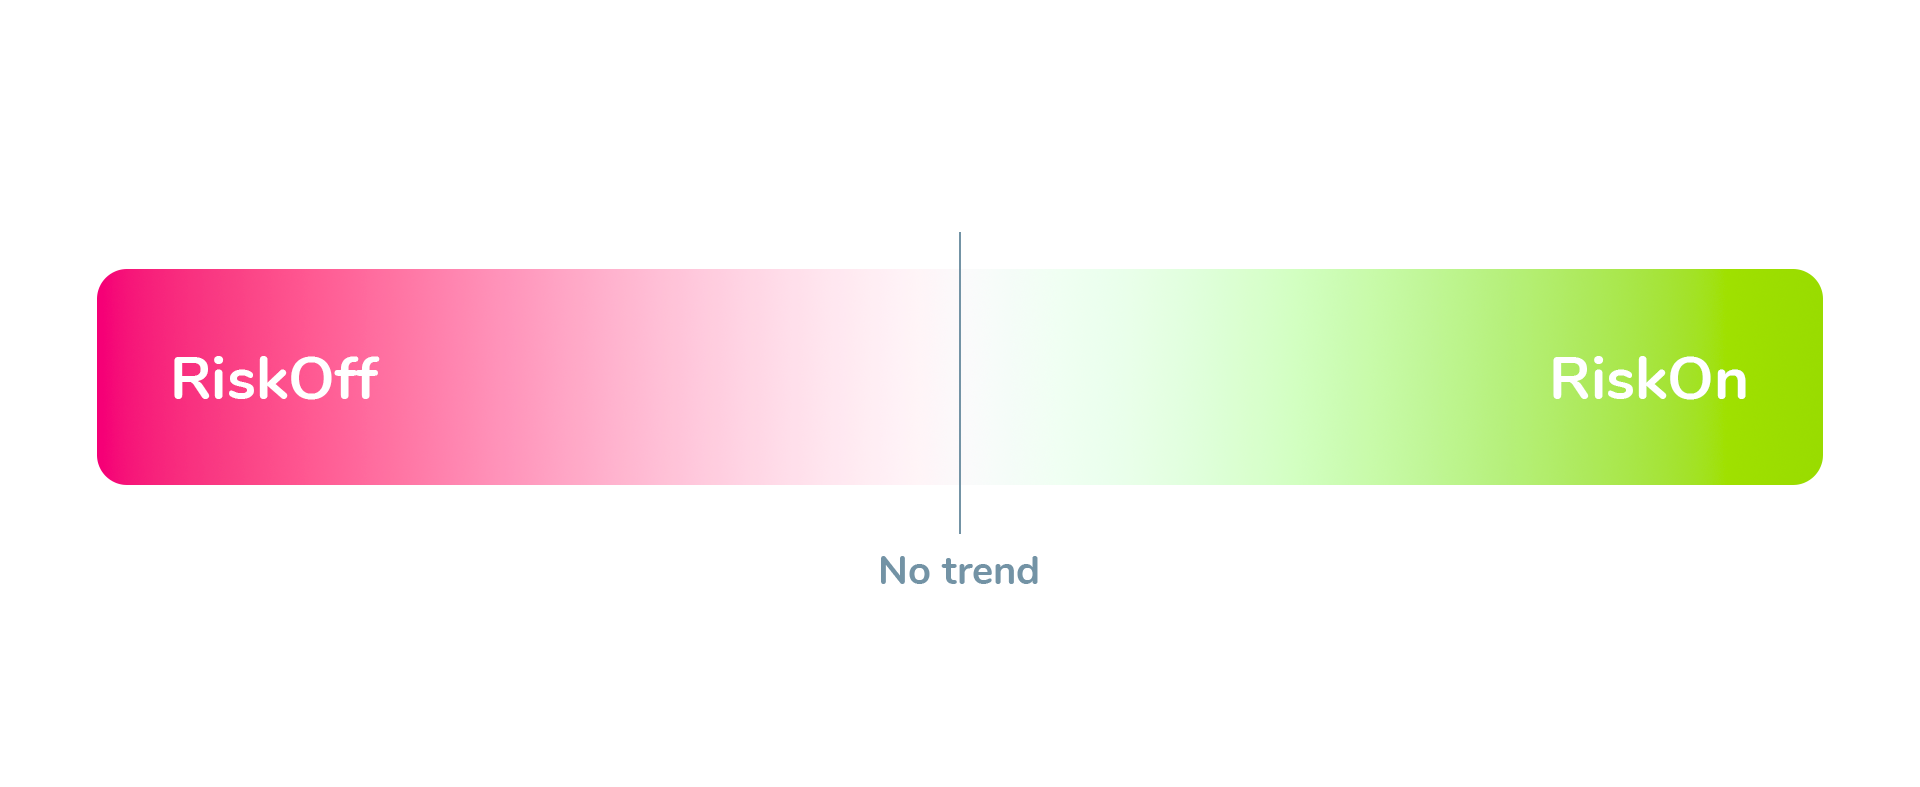
We further use the values of the Moodix index™, its moving averages and their relative positions to each other to more accurately determine the current trend direction of sentiment. This results in a finer sentiment scale ranging from a strong growing RiskOn on the one hand, to an unclear sentiment state in the middle of the scale – Neutral no trend, to a strong growing RiskOff on the other.
For more on the different sentiment levels, see HOW TO USE
We update the Moodix index™ and market sentiment after each measured news
Each piece of breaking news changes the value of the Moodix index™ more or less depending on the strength of the news and thus plays a part in the evolution of market sentiment. Therefore, we update them within moments upon measuring each piece of breaking news. This is important because in some cases even a single piece of breaking news (what we call a game changer) can change the direction of market sentiment. In the moodix web app you can thus monitor the development of market sentiment in real time.

