what the markets think
The sheer volume of world news and events which have a huge impact on the financial markets can be overwhelming.
Moodix helps you make sense of this seemingly endless flow of information.
Attention: this is a beta version. It is still under development!!!

Step one
We collect all news
We continuously monitor more than 30 of the largest and fastest news sources on Twitter. You won’t miss a single news report anymore.

The principle of the Moodix app is based on freely available data from Twitter. Using the API, we automatically download and save complete news coverage from the largest news agencies. The news reports are saved according to the time of their publication (on Twitter) and therefore we know exactly when they were published. Whatever is happening, Moodix will learn about it and that’s how it all begins.
Quality resources are vital.
We carefully select and continously asses the sources we monitor. The speed is what matters here the most. So, we use news sources that prioritize the speed as well.


and many more …


step two
we sort news by topics
Using machine learning, we automatically classify individual reports based on their topics into respective categories.

The first unique feature of Moodix is the sorting of news reports and their classification into respective categories. We sort and categorize thousands of pieces of news per day using our algorithms . This allows you to focus on those categories of news and information that fundamentally affect the financial markets. You no longer have to spend your valuable time reading unimportant news. Instead, you can focus on news reports that fundamentally affect the financial markets.
We have developed a unique algorithm for the automatic categorization of news. The algorithm is based on machine learning. It constantly analyzes old and recently published news. It also automatically creates new news categories when needed. The Moodix app gives structure and clarity to the constant chaotic flow of information.
Learning from published news.
We use all news retrieved by Moodix for machine learning. Recognition of news reports and their classification into individual categories is a crucial function of the entire application. With such huge amount of news every day and the speed with which they are published and directly affecting the financial markets, it is completely unrealistic to do this manually.
80% sorting success
All reports can be classified into respective categories based on their content. We strive to classify each news report to one of these categories. We currently have an 80% success rate in this. Since we know the publication time of each report, we can group them into time blocks within their respective categories.
Searching for news by categories and publication time
Moodix allows you to search all saved news reports. This is made easy by filtering the news based on categories and publication time. You will then know when e.g. Angela Merkel spoke about Brexit or, for example, Trade Wars.
Attention: this is a beta version. It is still under development!!!

step three
We measure the strength of the impact of news waves on the financial markets
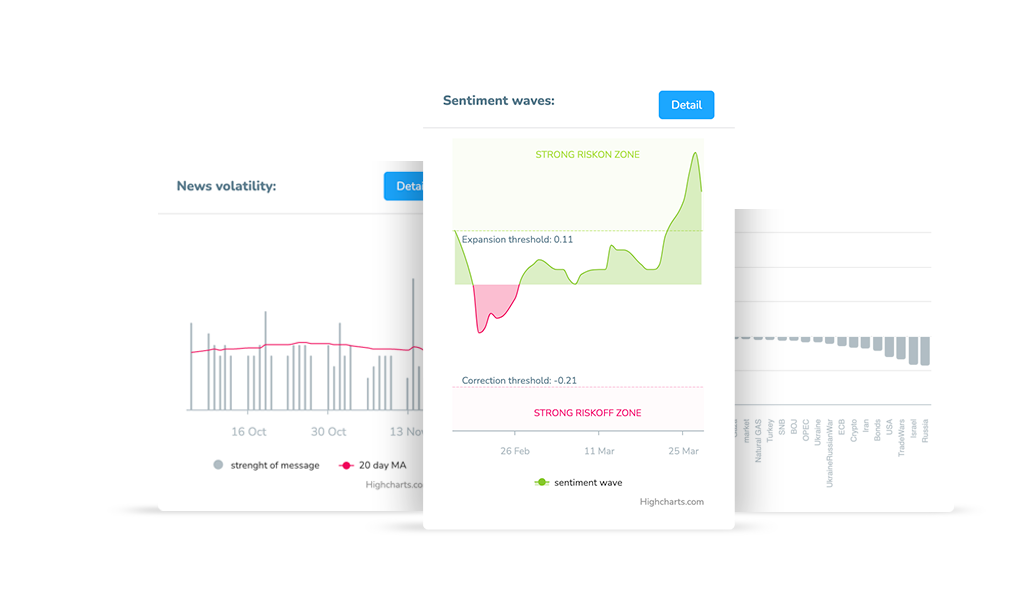
The news affecting the financial markets do not appear in isolation but rather in waves concentrated in certain time periods. News agencies compete at the speed with which they inform about new facts and events. It is precisesly the speed of these agencies and machine learning which allows us to capture these waves based on the quantity and frequency of published reports and above all, to measure the strength of their impact on the financial markets.

Pretty much everyone who strives to understand the laws of the complicated world of financial markets as well as the key factors that determine their performance is no stranger to this daily routine of the consuming continuous flow of information, their accurate analysis and meaningful sorting, i.e. the basic building blocks of any successful trading strategy. This requires a substantial amount of mental effort and way more time than the trading itself. In short, we all know that without a detailed overview of what is happening in the markets and a deep insight into the factors that determine their performance, there can be no successful trade.
Our tool allows you to make sense of this continuous, rapid flow of news, to categorize it and transform the entire news stream into waves which are way easier to interpret. The individual waves indicate which news report (or group of these) significantly affects the performance of the financial markets and which does not. By simply clicking on the information wave, you will access individual news reports and immediately get an idea of the situation which in turn will help you act immediately. What had before taken you a long time to do, you can now do in just a few seconds.
Attention: this is a beta version. It is still under development!!!
Understanding the market
We are all familiar with this daily routine. Every morning you sit down, look at the financial markets and read everything you can get your hands on. Every trader needs to orientate themselves but above all, they need to understand the key events affecting the markets that took place when they were not monitoring the situation. Moodix Activity Graph allows you to see what’s happened in the past several hours or days and which news categories have had the biggest impact on the markets. In an instant, you will get a general overview of the situation and dive deep into a detailed analysis of specific news. Stop wasting time by going through an often random set of news and don’t risk missing the essential ones. Find out what truly matters. Effortlessly.
Sorting topics according to the strength of their impact on the financial markets
We sort individual reports to their respective categories based on how strongly they impact the financial markets. This allows you to observe how the markets’ focus transition from one topic to another over the course of minutes and hours. The main benefit of this is having an immediate overview of events that most affect the movements of financial markets and their prevailing sentiment. You will quickly gain comprehensive insight into the situation, which will allow you to competently set your own trading strategies.
Weekend news activity
A major challenge in determining the impact of news on the financial markets is the time period when the markets are closed, i.e. on weekends and some holidays. However, news coverage simply does not stop on these days. Specifiaclly for this, the app includes a chart of topics which are active on these days, so you can prepare for when the trading is resumed.

step four
we measure sentiment based on market reactions to news
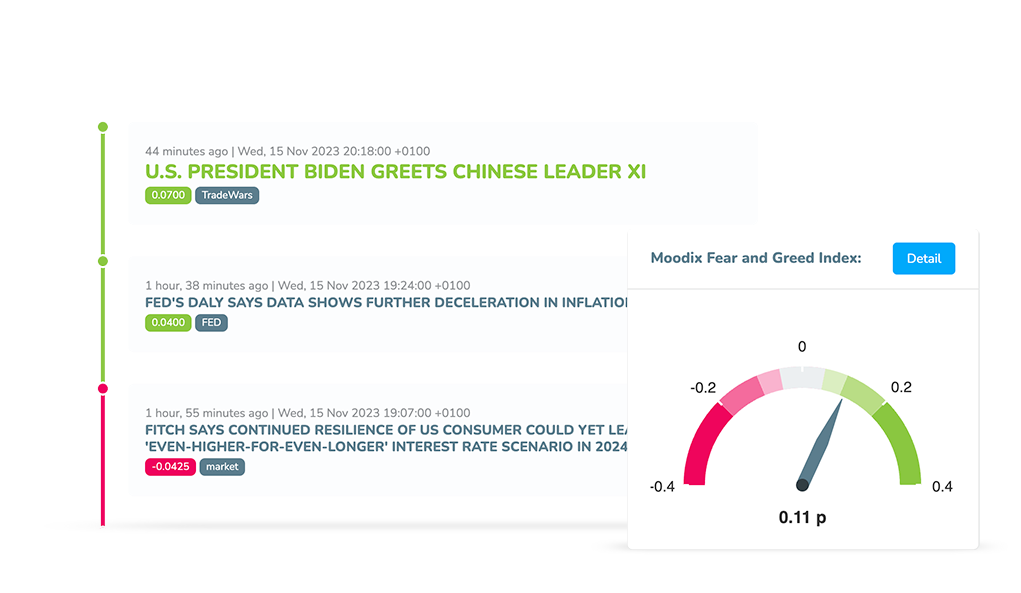
The financial markets respond directly to some news with so-called “gaps”. We measure these immediate reactions to news and use them to calculate the Moodix Sentiment Index.

Some of those hundreds to thousands of news and events that transpire during a day represent so-called “Market Movers”. These are the news reports and events that are changing the current sentiment and forcing the major traders to react immediately. Market Movers include sudden sales, purchases or hedging even before a thorough analysis of the report is made. Sometimes this happens out of pure speculation about future developement. The major traders include market makers, funds’ hedging systems, robust scalping systems and more recently, central banks. They all have one thing in common – they all use trading algorithms.
They trade automatically and extremely fast.
The Moodix application is based on the assumption that these traders make up the majority of the daily volume of trades executed. They trade all the time and there are hundreds of them. These traders also have a huge amount of funds and have different motivations, objectives and targets. Their immediate response to breaking news is therefore very important. Their reactions are supported by huge teams of analysts who constantly monitor and evaluate the situation. They constantly adjust their probabilistic models and business strategies accordingly. Almost certainly, they use some form of artificial intelligence to monitor and evaluate current events. The AI calculations are capable of calculating various future developments within milliseconds and adjusting trading systems accordingly.
Whatever the reality is, it is the speed and size of their analytical teams that allows these major traders to be one step ahead of other retail traders. When an average trader realizes that something is happening and that he should make a move, this change in sentiment is usually traded long ago. Algorithms are able to respond in seconds, while processing and analyzing more complex topics takes a couple of minutes. The market reaction itself, the so-called “gap”, usually represents a consensus of all those big analytical teams. This is the final “truth”, no matter what we think about it. It represents the reaction of the biggest traders and has a great telling value. Using the Moodix system, the app searches for these gaps, systematically measures them and assigns specific news reports or categories of reports to them. The reports that provoked such a reaction are called Market Movers.
How the Moodix Sentiment is calculated
The measuring takes places from Sunday’s opening until Friday’s closing of the financial markets. Every day, regardless of time zone, begins with the opening of markets in Asia and the closing of markets after the US trading session. The news reports are saved based on this time frame. Therefore, the time zone plays no role in the calculation.
The measurement takes place from Europe and currently we are not able to monitor and measure markets continuously. Therefore, the measurement is delayed during the night. We complete the calculation of the night session before the European session is opened. The calculation of the previous day is always completed 10 minutes before the opening of European markets. At the same time, we publish the current value of the index, including that from the Asian session.
Gaps on Market Movers News
We are looking for market gaps, i.e. reactions to Market Movers news, in the futures contract of the SP500 (ES) index. Specifically in the volume profile. These gaps are mainly defined by a major, often several-fold increase in volume. Looking at the volume, we orient ourselves and are able to accurately identify the news that provoked this reaction. We then measure the news report – determine its strength/degree of reaction of the markets to it, its topic/category and save it in the system.
Index calculation
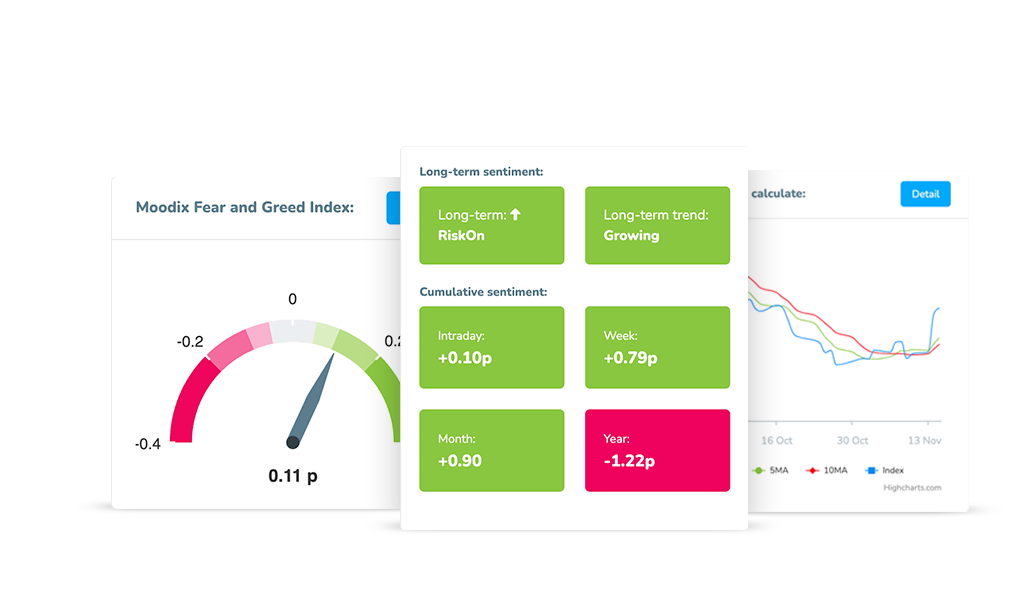
The degree of impact of a report on the financial markets is expressed by a numerical value, which can be positive or negative according to the direction of the impact (positive/negative) on the markets. When saved in the system, these values are added together resulting in a total daily value of the index. The value is reset to 0 every day. The Moodix app uses a comprehensive set of parameters that are assessed and measured for each report (response size, volume, etc.).
Identification of topics is crucial
In the long run, markets are affected by different news topics/news categories. Some of these news topics are permanent (data on economies), while others are temporary (e.g. Trade Wars, the Covid-19 pandemic) and are replaced over time. Individual reports and information are actually just updates of these topics or categories. Since Moodix categorizes all reports into news categories, we are able to determine the index of the impact of individual topics on the financial markets. Is there positive news from the Trade Wars category? Is there negative information on the Covid-19 pandemic? The Moodix app and its index will allow you to monitor only those topics that set the financial markets in motion and, conversely, avoid those that despite their apparent importance, do not impact the financial markets in a substantial way.
Sentiment trend
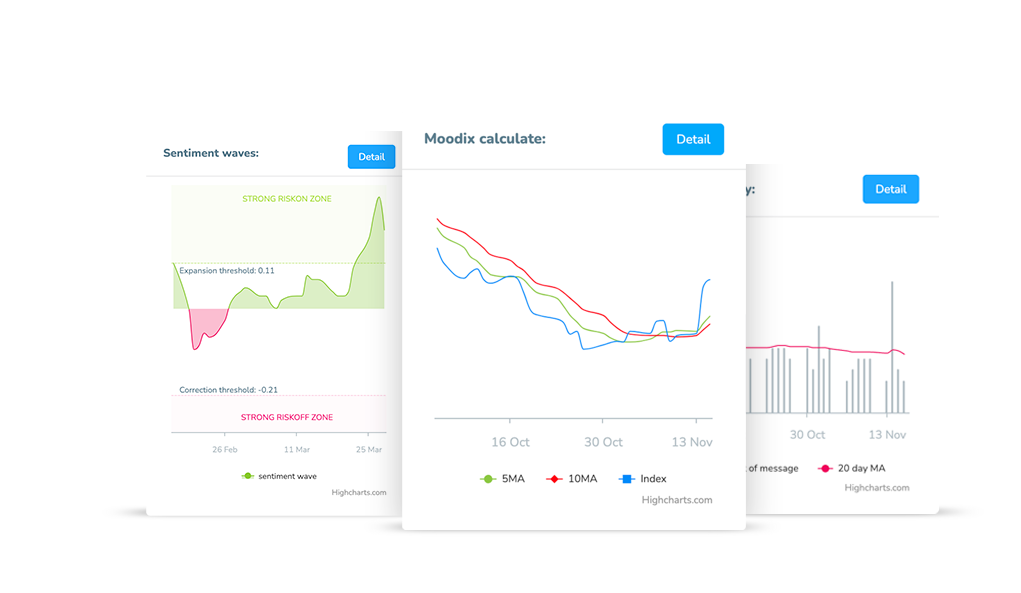
The daily changes in the Moodix index, allows you observe the index increase or decrease. Using a time frame of weeks to months, it is possible to observe changes in the mood in the financial markets, the so-called “waves of sentiment”. Sentiment is constantly transitioning between good (RiskOn) and bad (RiskOff) moods. To better interpret these waves, we use the Moodix Index rolling averages of the last 5 and 10 days. The differences between these averages indicate the strength of sentiment and trend.