How to use
Thanks to moodix measurement, we can identify the market sentiment and its trend. We time the markets!
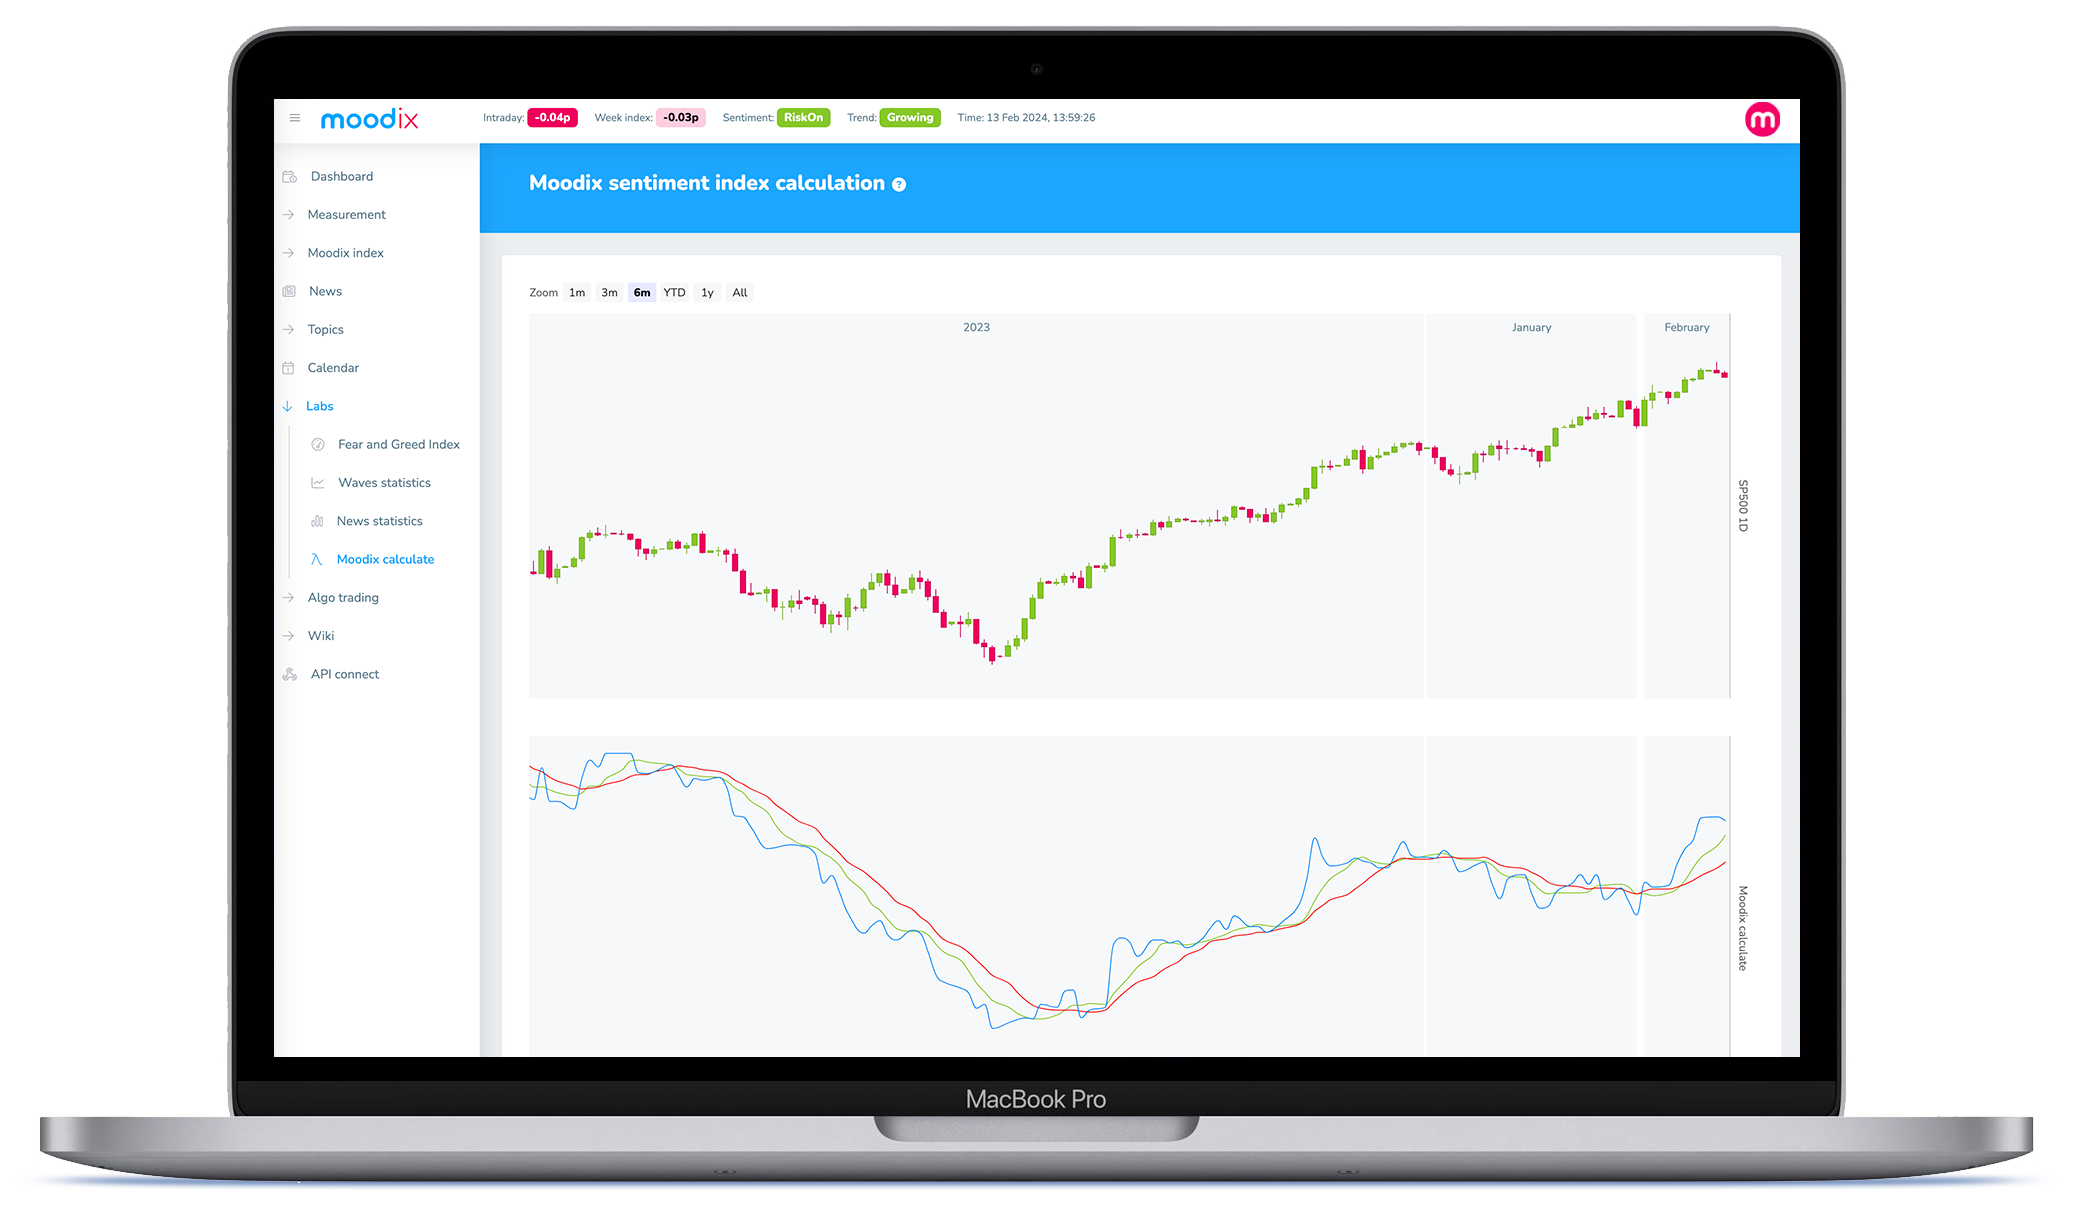
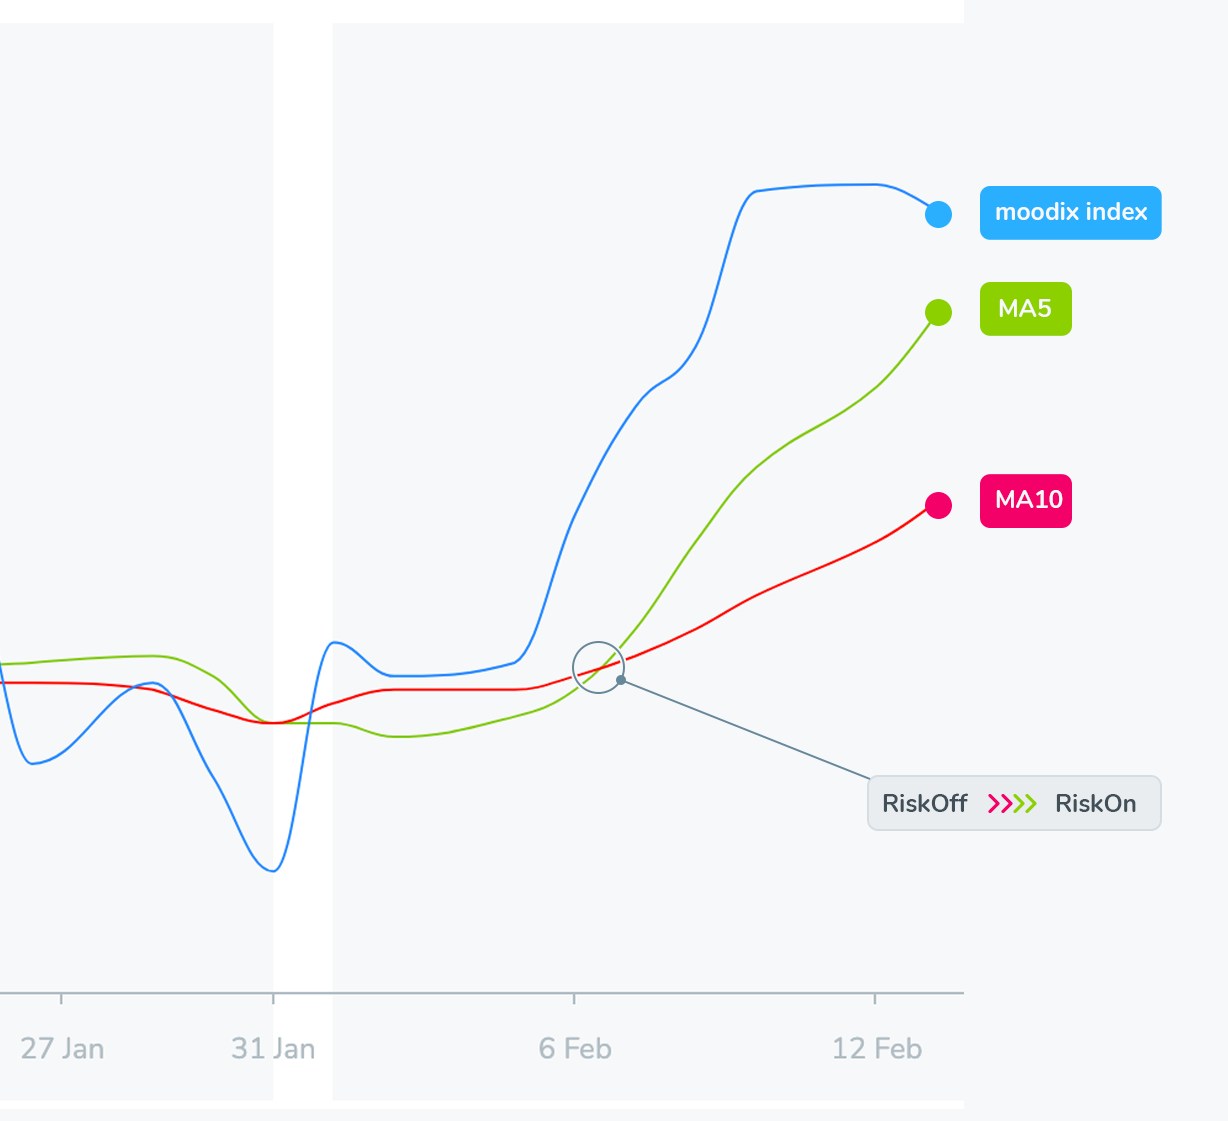
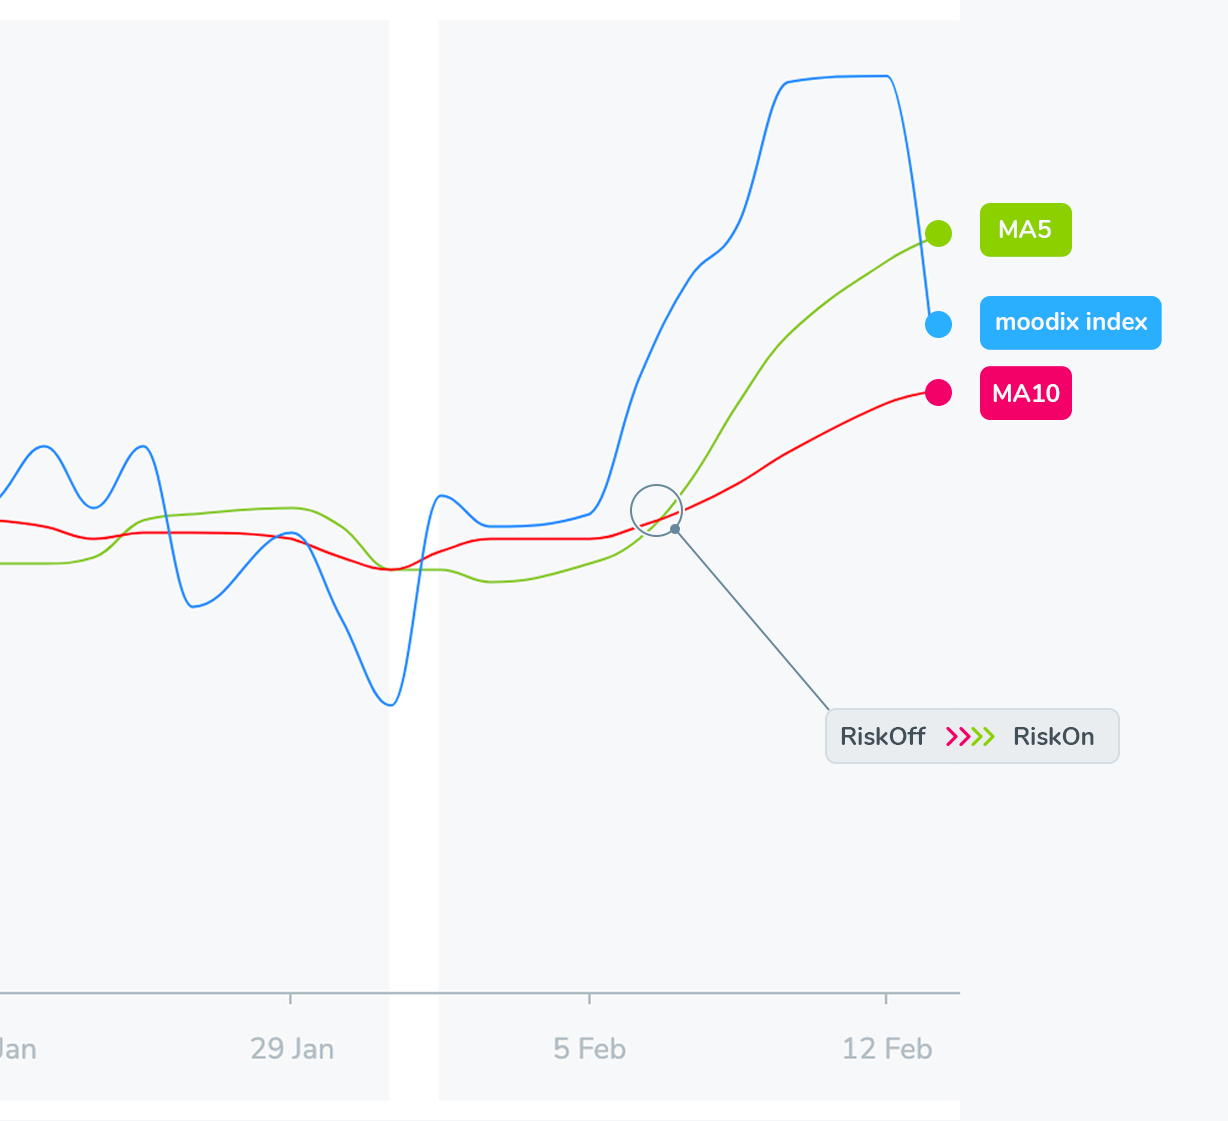
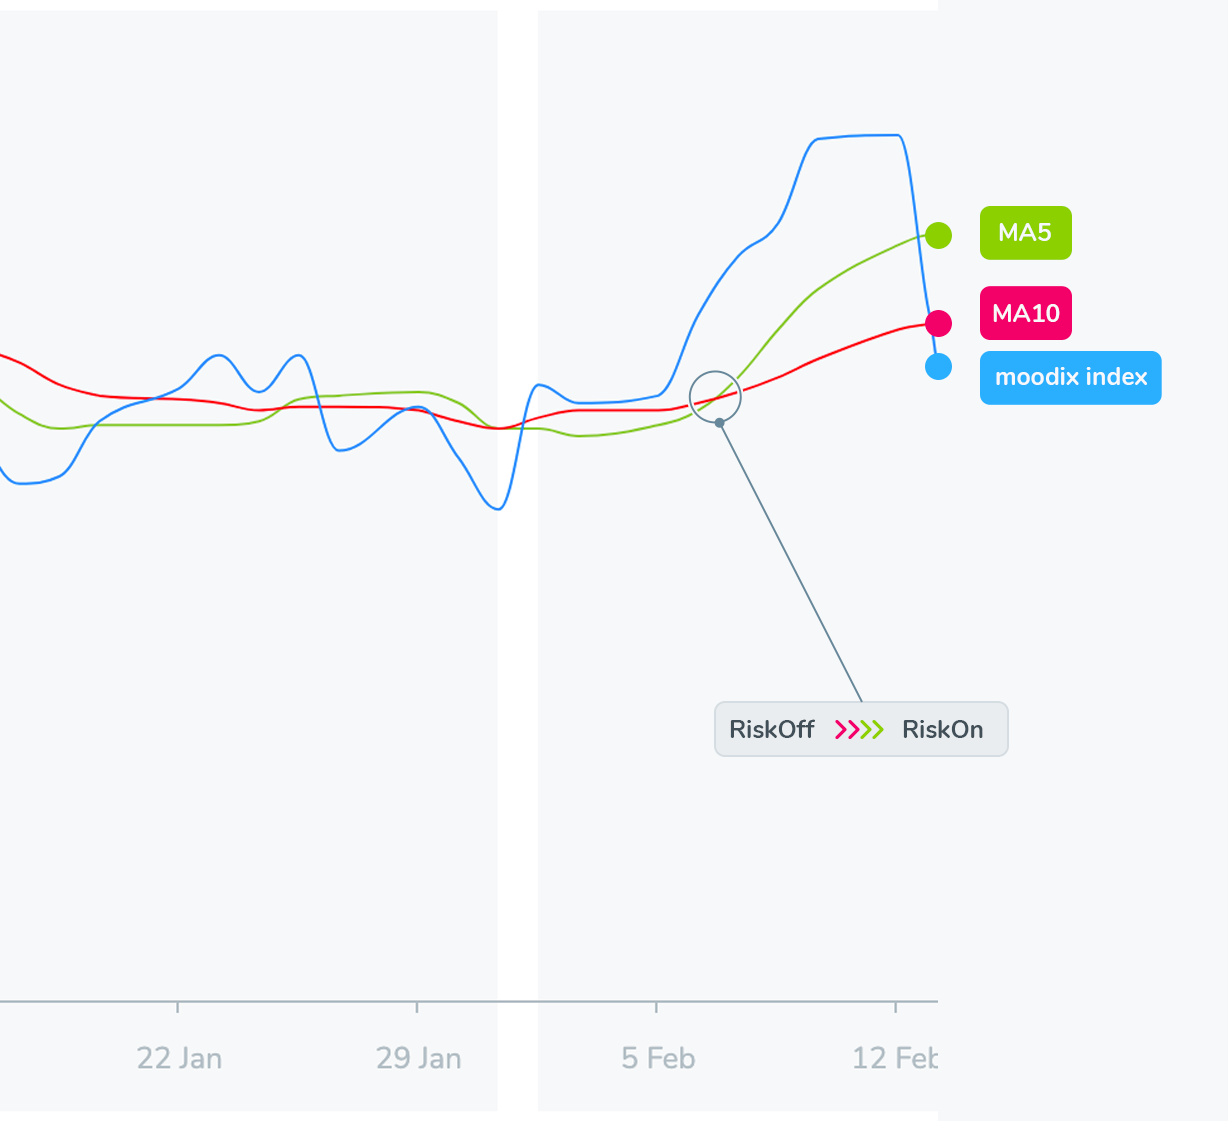
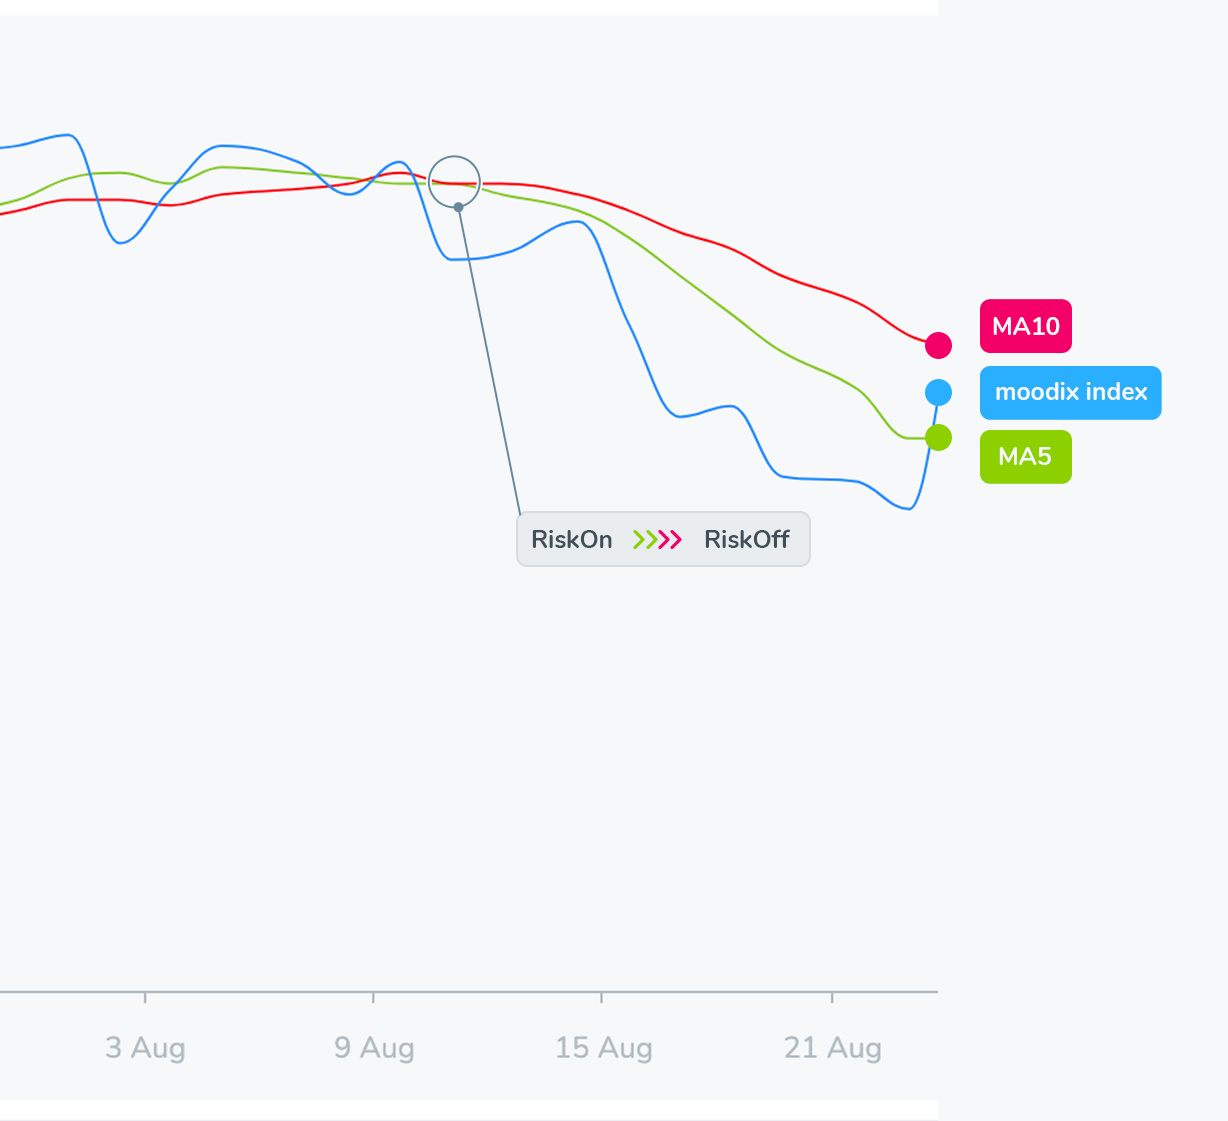
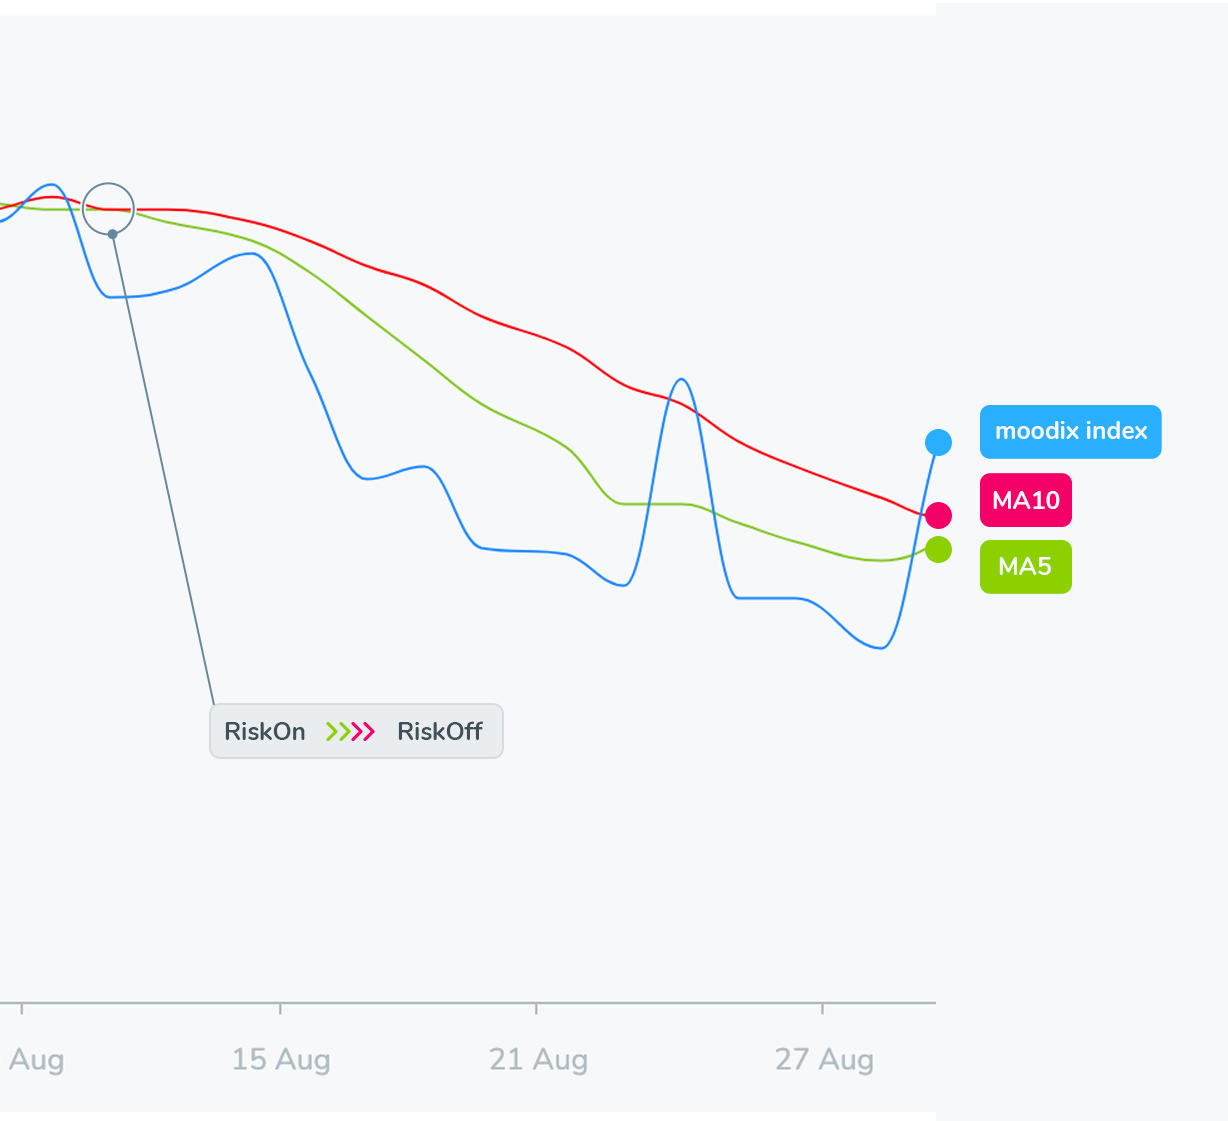
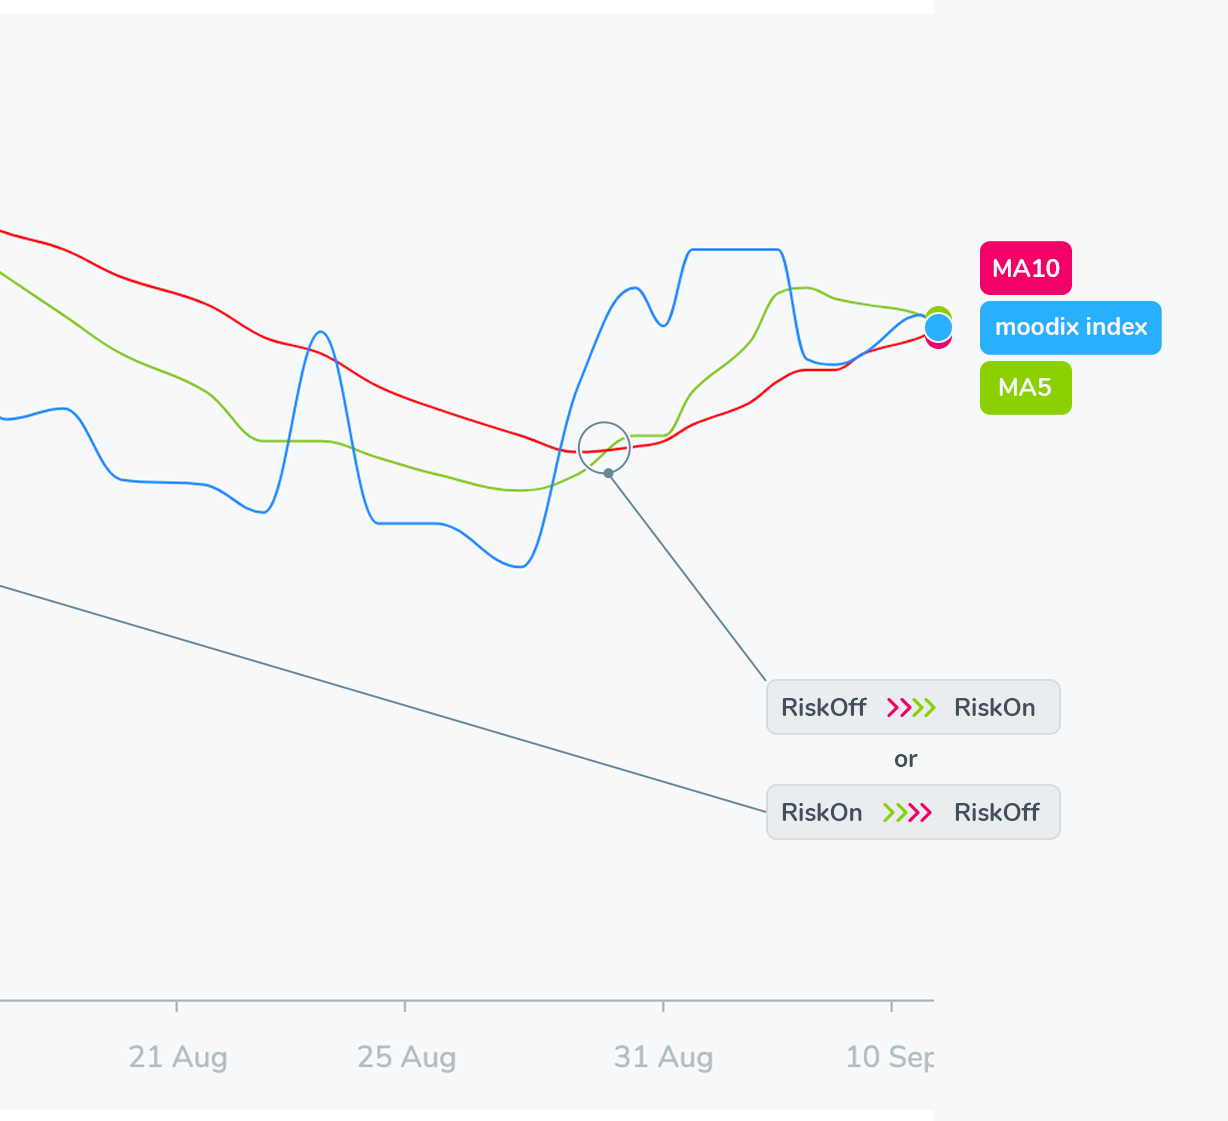
As you found out in how it works, we calculate sentiment waves based on the mutual distance and positioning of the 5-day and 10-day moving averages of Moodix index™ and it’s current value. To understand the significance of sentiment waves, it is essential to understand the very essence of information we gain by looking at the measured sentiment and its trend.
The context of breaking news
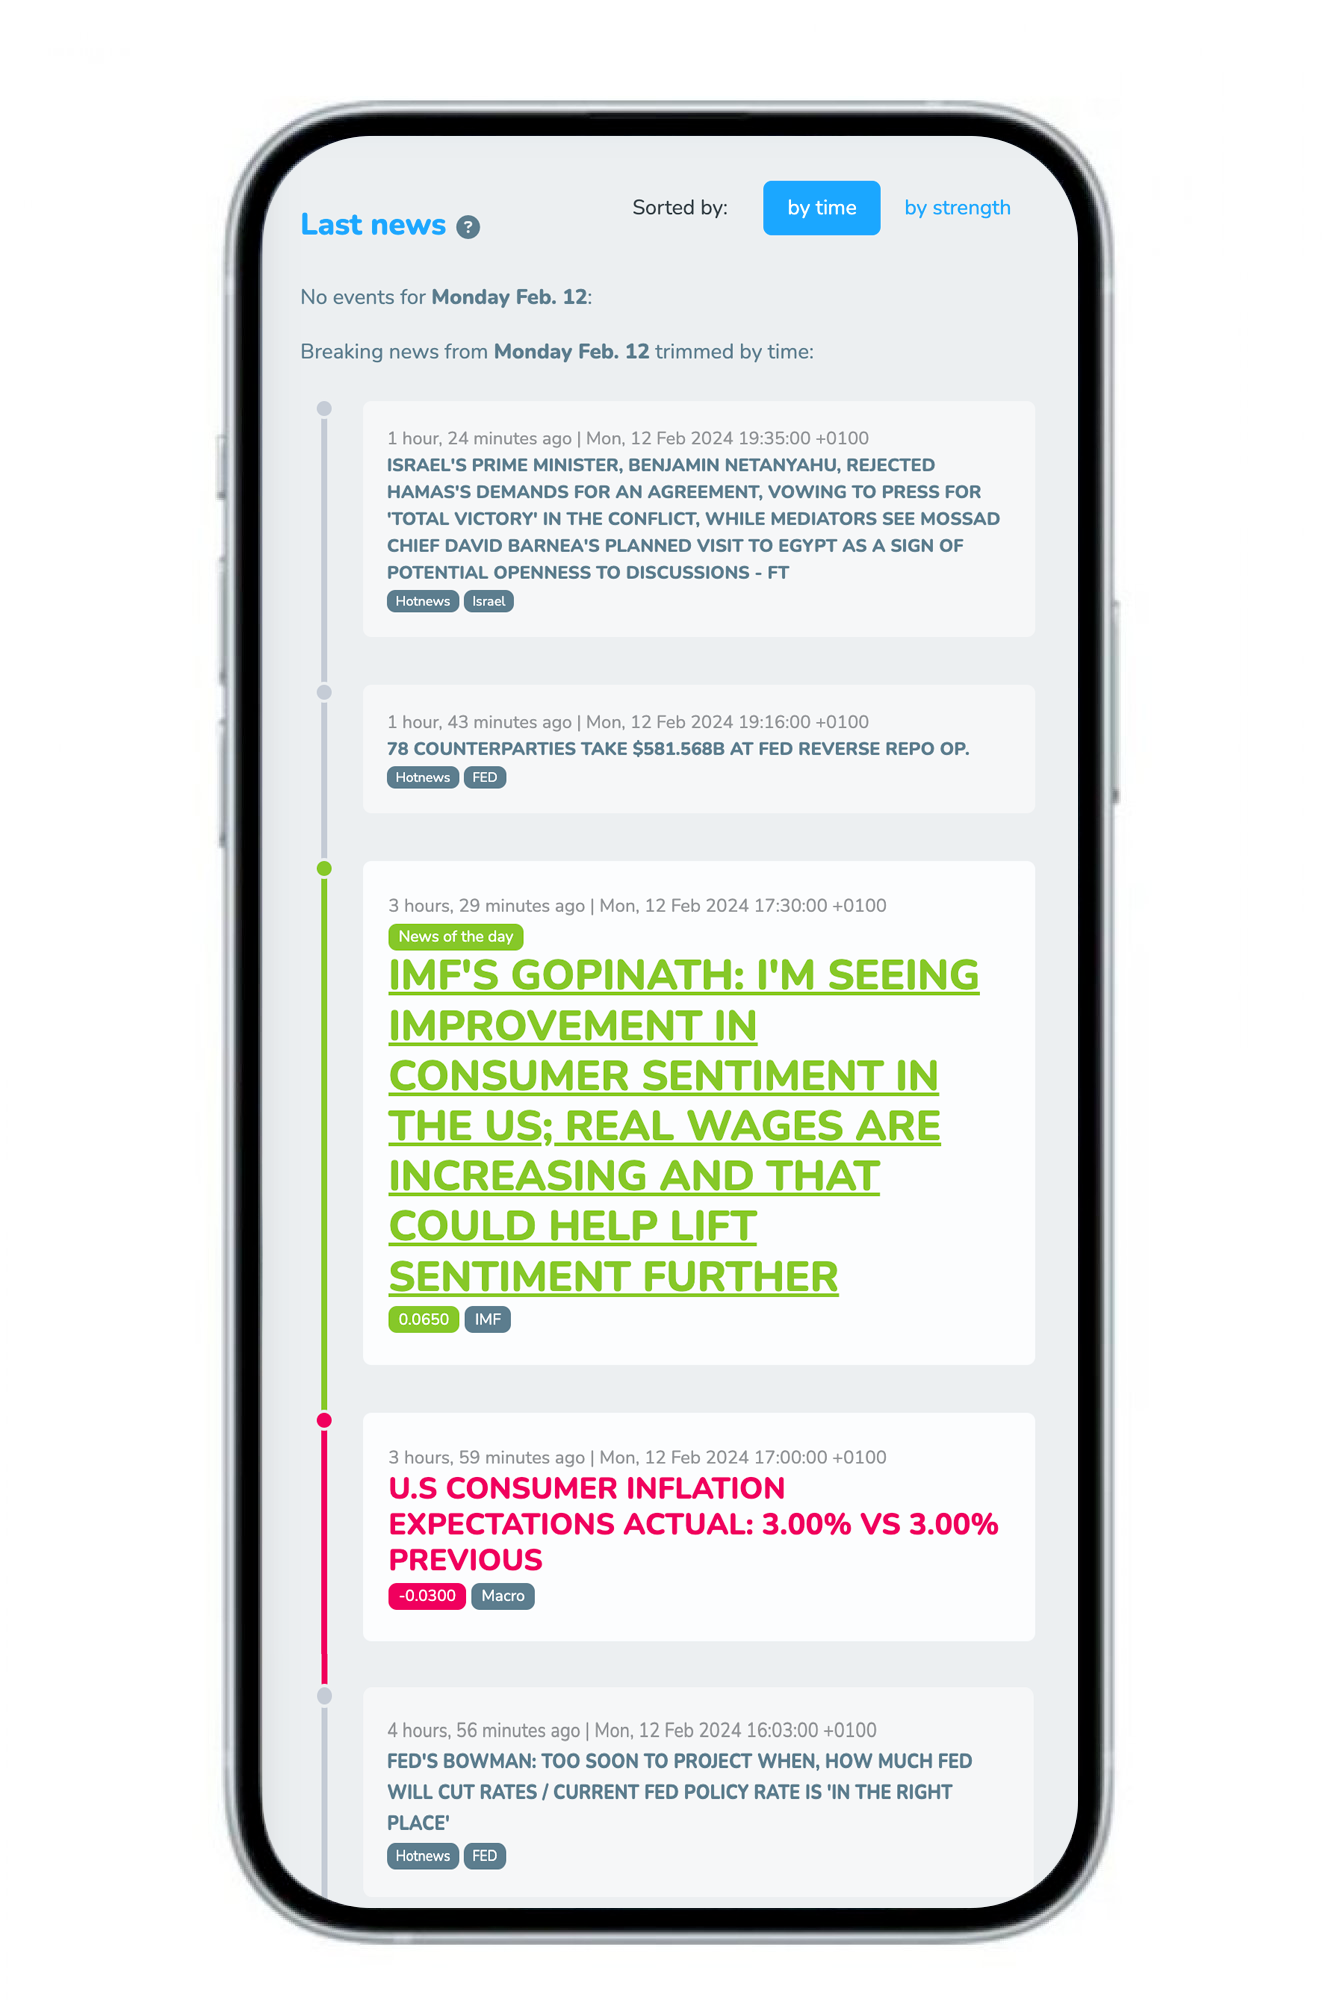
For the best understanding of market sentiment, it is crucial that you read the individual breaking news each and every day. We recommend dedicating 30% of the time saved by using moodix app to reading the news that influenced the financial markets. Think about it and ponder over it.
If a piece of news or an entire topic creates positive or negative pressure on the markets, try to consider how the market will likely process the theme. What does all of this mean for future developments? Well many traders use moodix just at the level of reading waves and take full advantage of its simplicity. However, from our observations, those traders who think deeply about the news affecting the markets achieve much better results. Reading only the waves is like playing football with a blindfold on and not knowing who your next opponent will be. On the other hand, reflecting on breaking news is like having detailed knowledge of the opponents you will meet in the upcoming matches.
Market related topics
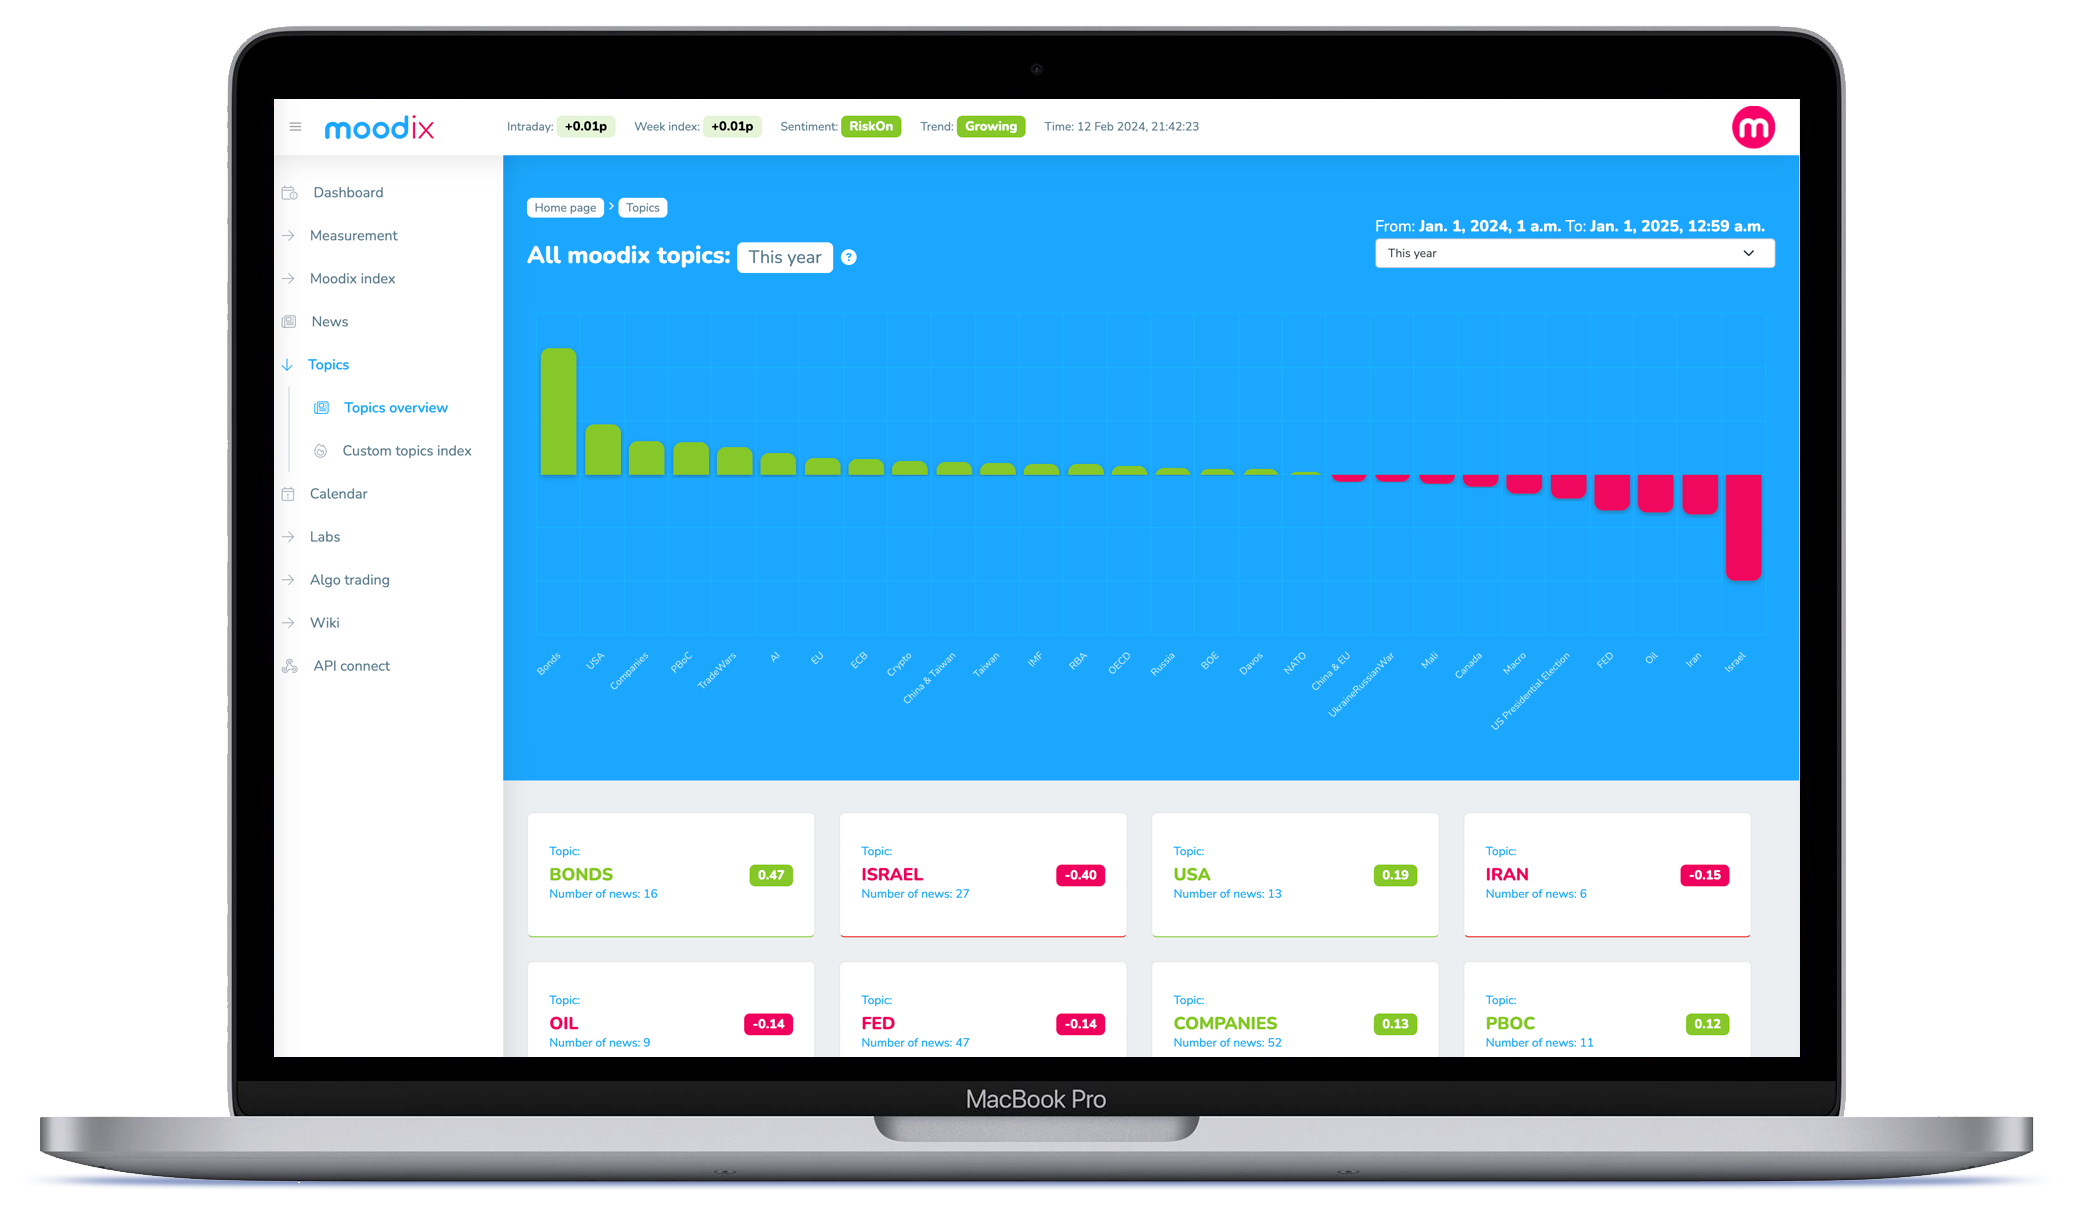
Each and every piece of breaking news belongs to its respective topic according to its content. Central bankers from the FED and their speeches/statements fall under the FED topic, regularly released macro data under the macro topic, etc. These topics, if they already contain enough news, create their own cumulative index and you can see how individual themes have influenced the market over time how they influence the market now.
Thanks to moodix, you have the opportunity to follow topic indexes like the FED, ECB, China, etc. For instance, if markets start to decline due to deteriorating macro conditions, you can focus on this issue and track how it develops over time and the pressure it creates on the markets.
Understanding waves of sentiment
Market sentiment changes over time and varies in strength. Similarly, RiskOn and RiskOff sentiment waves have their own length and depth.
The longer a sentiment wave lasts, the stronger the market sentiment and the clearer the beginning of a trend change can be observed. However, time is relative! Some negative waves (for example, Covid or the war in Ukraine) lasted several months and provided huge opportunities for market declines. However, the duration of the wave is not as important as its strength. In the moodix application, we display the long-term averages of the strength of positive and negative waves of sentiment. This makes it easy to recognize (especially with negative RiskOff waves) whether the market sentiment is strong enough for a trader to begin defending their portfolio or for example, speculate on a larger/deeper market downturn. As long as the RiskOff wave does not fall below the average threshold, we consider it more of a market test and likely a later opportunity to buy risk assets. For more info about this threshold and its use, see Interpretation of measured market sentiment.
Understanding sentiment trends
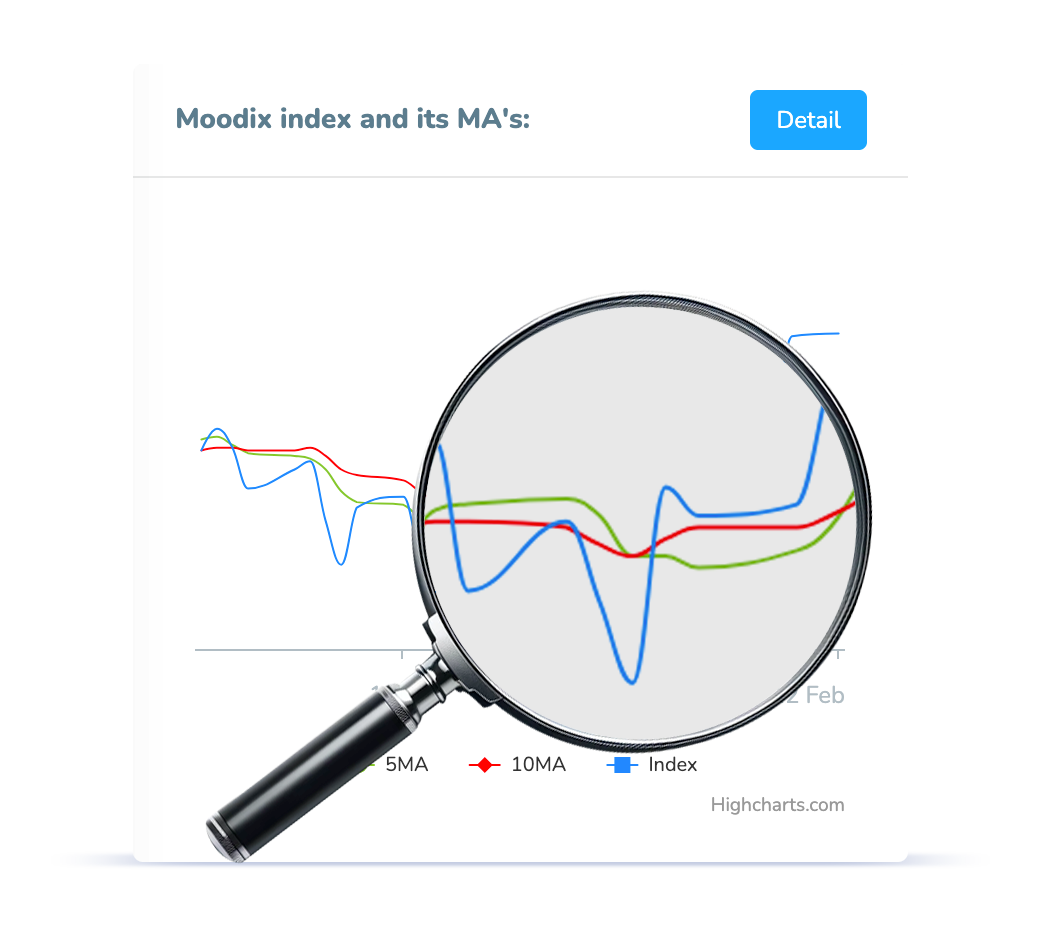
Thanks to the way the current moodix index itself moves around its moving (MA5 and MA10) averages – known as market memory – we are able to calculate the trend/direction of the current moodix wave. The states of individual waves and trends, in some cases, provide both long and short signals. However, at moodix, we recommend sticking with what seems to be the very essence of stock markets, which is growth. Therefore, we primarily concentrate on long signals and we use negative sentiment periods to take some rest and stay away from the markets to rejuvenate our own mental strength.
Each sentiment trend’s degree can be precisely described:
Wave: RiskOn
Trend: growing
This state of market sentiment causes an increased appetite for risk, named RiskOn in moodix. The currently measured news are more positive than the news from last 5 and 10 trading days. Markets tend to rise despite potential technical resistances, willingly confirming various price supports and trend lines. The market quickly forgets any minor negative news. Most DIP movements are bought up. In such a measured sentiment, it is advantageous to undertake increased, but as always on the market, safe risk.
Wave: RiskOn
Trend: sideways
This state of market sentiment signals the likelihood of sideways trading in the current RiskOn trend. If the wave has persisted for some time, markets tend to be considerably tired and begin to forget the reason for their growth (market memory). This environment can be utilized for allocating new positions with reduced exposure to potential DIPs.
Wave: RiskOn
Trend: fading
This state of market sentiment usually signals the end of a positive mood in the markets. The current Moodix index™ is below the average market sentiment for 5 days and the sentiment for 5 days is worse than the sentiment for 10 days. This market mood is usually accompanied by increased volatility (the market is under pressure from the current topic). It is wise to wait and see whether the current worsened mood improves or a RiskOff wave begins. If the negative sentiment does not deepen further, the market has likely absorbed this pressure and the topic is no longer relevant to it. In this environment, it is best to wait or to allocate capital with the lowest exposure.
Wave: RiskOff
Trend: growing
This state of market sentiment causes a decreased appetite for risk, colloquially called RiskOff. The currently measured news is more negative than the news from the last 5 and 10 trading days. If the strength of the wave is below the average of RiskOff waves, markets tend to voluntarily/eagerly decline. They react strongly negatively to most insufficiently positive news, breaking through various technical supports. The market awaits a strong positive signal to reverse the mood. It always depends on the actual topic that caused the negative sentiment. In such measured sentiment, it is advantageous to minimize capital allocation on the long side, start hedging the portfolio, stay out of the markets, or trade the short side.
Wave: RiskOff
Trend: sideways
This state of market sentiment signals the likelihood of sideways trading in the current RiskOff trend. If the wave has persisted for some time, markets tend to be considerably tired and begin to forget the reason for their decline (market memory). There is also an increased probability of the first signal of an emerging RiskOn wave (the beginning of the end of the current RiskOff). It always depends on the context of the current mood—how long it has lasted as well as what caused it. If a trader concludes that we are observing the end of the negative mood, this moment can be an excellent place to allocate a long position. However, if we are in a long negative trend, it is better to wait for confirmation and a state of RiskOff Fading.
Wave: RiskOff
Trend: fading
This state of market sentiment signals a significantly improving market sentiment. The current Moodix index™ is above the average sentiment both for 5 and 10 days. This sentiment state is usually accompanied by strong long purchases, strong signals of the end of RiskOff sentiment. Here you will have some increased volatility. Most of these signals end with a switch from negative RiskOff sentiment to positive RiskOn. We should in this case allocate capital on the long side of a trade.
Wave: No trend
Trend: No trend
This state of market sentiment indicates an indistinct environment, without any trend-driven sideways trading. In this environment, we recommend waiting for further development. This state usually lasts for 1-2 days.
When trading according to our sentiment, we ALWAYS wait to see where the Moodix index™ closes at the end of the trading day. Markets tend to be very volatile, often surprising in one way or another and it may easily happen that an intraday signal is created but by the end of the session, this signal does not hold and returns to the original trend. We always wait for the close and confirmation!
When trading according to our sentiment, we ALWAYS wait to see where the Moodix index™ closes at the end of the trading day. Markets tend to be very volatile, often surprising in one way or another and it may easily happen that an intraday signal is created but by the end of the session, this signal does not hold and returns to the original trend. We always wait for the market close and confirmation!
Utilizing the Moodix index™ in different time frames
It is crucial to determine the time frame in which you are considering market sentiment. From the perspective of the measured Moodix index™, we consider three time frames:
The longer the time frame, the slower the market and the clearer the analysis of market sentiment. The faster the time frame, the more noise needed to be separated from sentiment itself. Therefore, for considering market sentiment in a long-term frame, we only need the Moodix index™. In medium-term time frames, we use the weekly moodix sentiment in addition to the Moodix index™ and for short-term frames, we also need intraday moodix sentiment.
Regardless of the strategy and time frame you use for capital allocation in financial markets, moodix can give any strategy a statistical advantage in the form of an increased probability of its fulfillment. The measurement indicates the most likely direction and the reason for it in the following hours, days and weeks. Moodix does not provide its own signals. You can view the back test of the Moodix index™ on a simple strategy here.
Long-term frames
Interpretation of measured market sentiment in weekly and daily time frames.
Medium-term frames
Interpretation of measured market sentiment in hourly time frames.
Short-term frames
Interpretation of measured market sentiment in minute time frames.
