Here comes the next moodix sentiment overview – an educational analytical article by our editorial team. These retrospective articles are like looking into a rearview mirror. We describe the past market events, global developments, and contextualize them with the evolution of our market sentiment indicator, Moodix index and other instruments we developed to provide you with unique tools for deeper insight in fundamentals and their impact on the market.
Our goal is to educate you, the readers and users of moodix, so that your understanding of moodix tools is at such a level that you can apply these tools effortlessly to minimize risks of your presence on the markets. To protect your own assets. To give you the decisive edge to make your market presence as safe and efficient as possible.
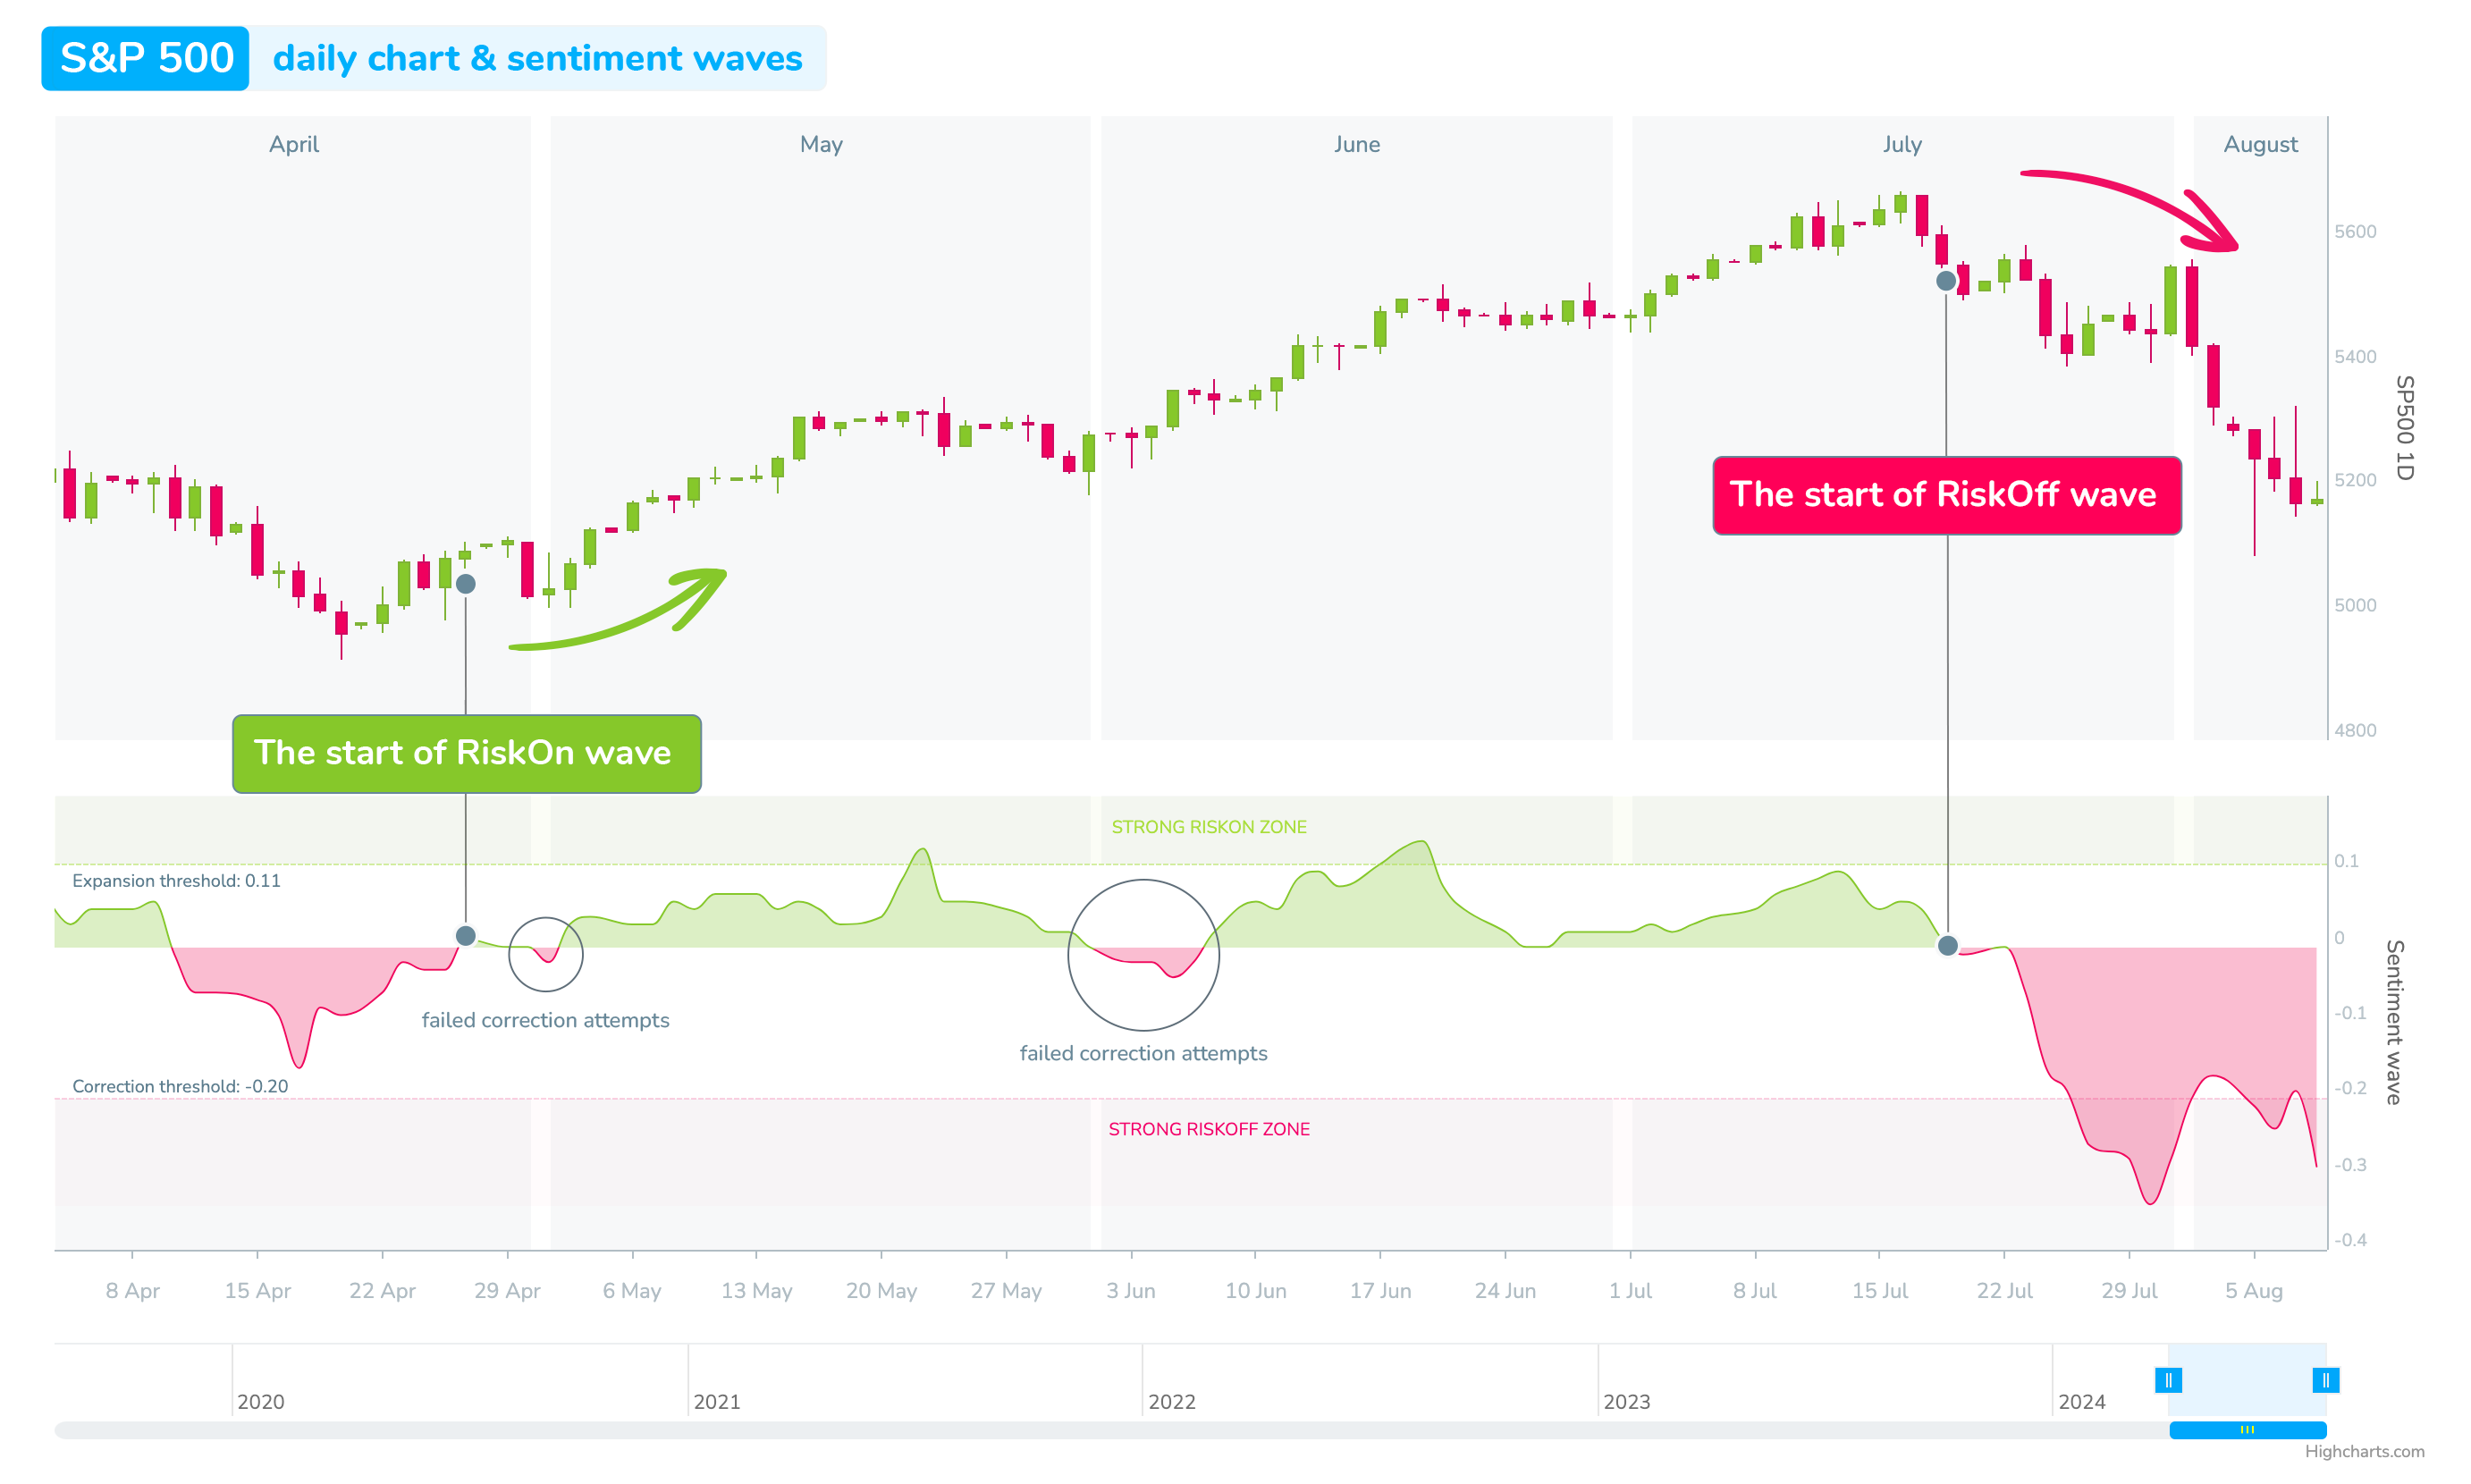
The last long RiskOn wave, including two minor RiskOff moments – failed correction attempts, lasted from May 2nd to July 18th, with a total length of 2.5 months. During this time, the S&P 500 saw a 12.5% increase (nearly 650 points). It kicked off on 5041p and at the the end we saw current ATH at 5672p. The causes of the start of this RiskOn sentiment wave were described in two texts. The first one describe the end of previous RiskOff, that spanned 22 days from April 10th and concluded on May 2, read it here: How Jerome Powell ended the last RiskOff? The second sentiment overview focuses on first two week of its span up until May 15th, you can check it here: Bullish Signals: Inside the Fed’s role in the latest RiskOn sentiment wave.
In this text, we will focus on describing the factors that contributed to the end of the market movement in the territory of positive sentiment and the onset of a relatively strong RiskOff wave on July 18. We will mention the most important, crucial breaking news and also take this opportunity to show you another new, very useful moodix instrument we have prepared for you, which will help you better navigate the stock market – the true volume tool, which provides a deeper context of the actually traded liquidity in USD on individual stocks of the entire SP500 index and its individual segments. And the correlation matrix between moodix sentiment and the parameters of the individual SP500 segments.
What fundamental factors helped maintain RiskOn in its second half from June 10 and which contributed to its end?
The turning point is the level of macro data and the change in the impact of some of them on the market, respectively, the change in the market’s reading of macro. Let’s illustrate this with examples of two macro data:
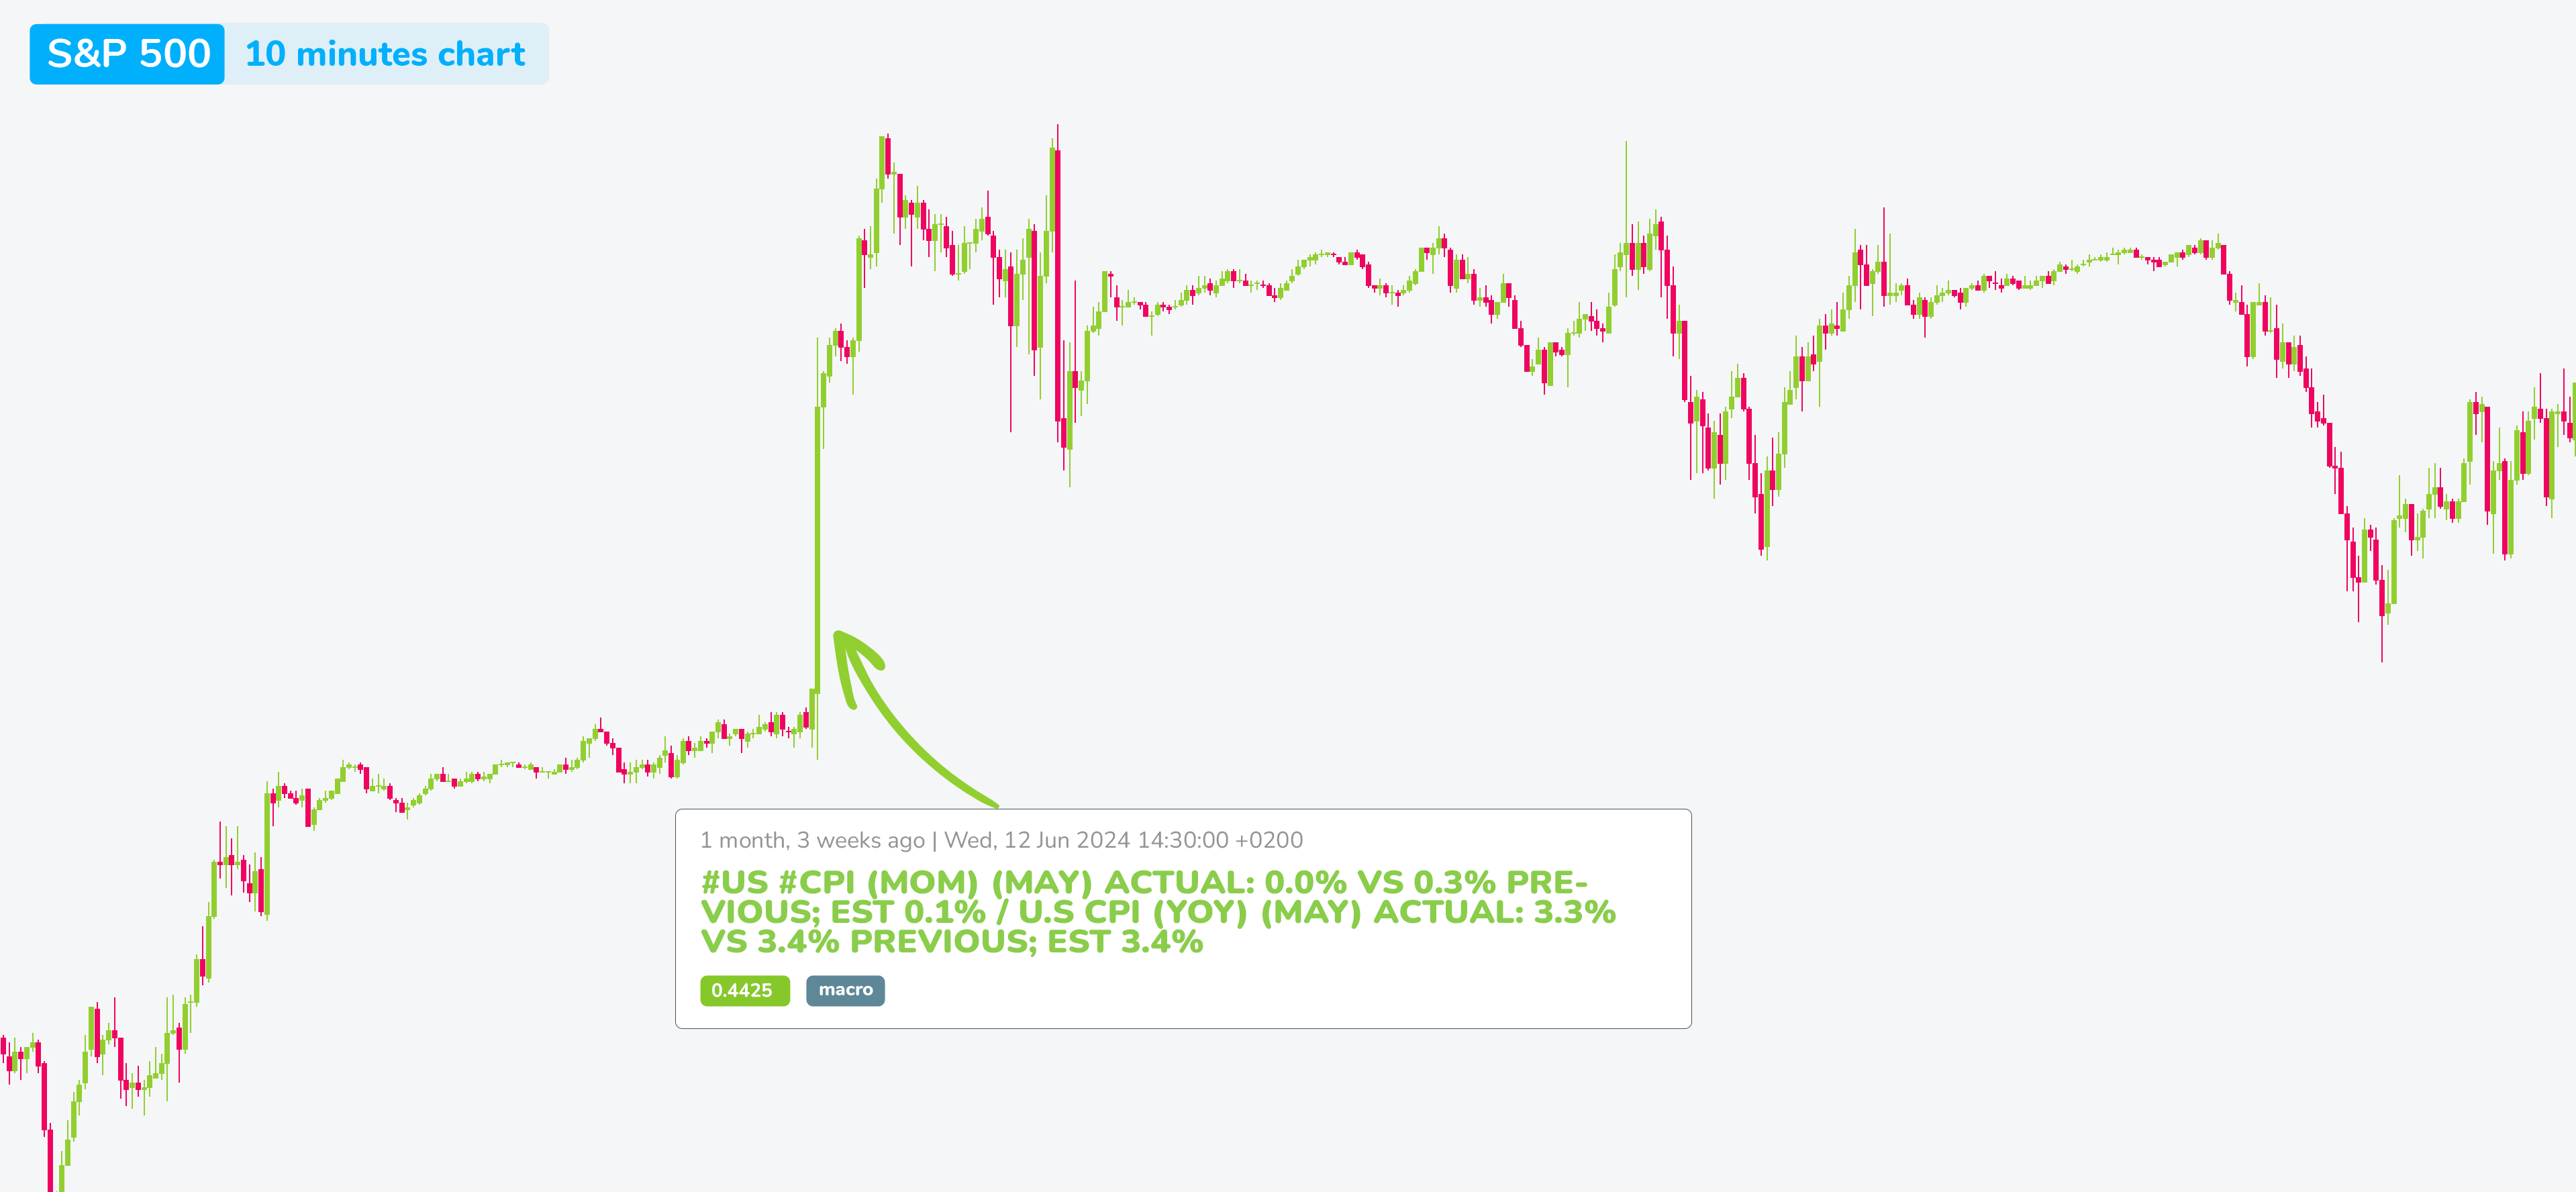
Let’s take a look at US CPIs first. After unfavorable inflation data from the first quarter of the year, information about the decline in consumer prices in the United States gave the market a really solid boost. The drop in US inflation, indicated by CPI on June 12, was one of the strongest news of the year with a value of +0.4425, making it the 6th strongest breaking news of 2024.
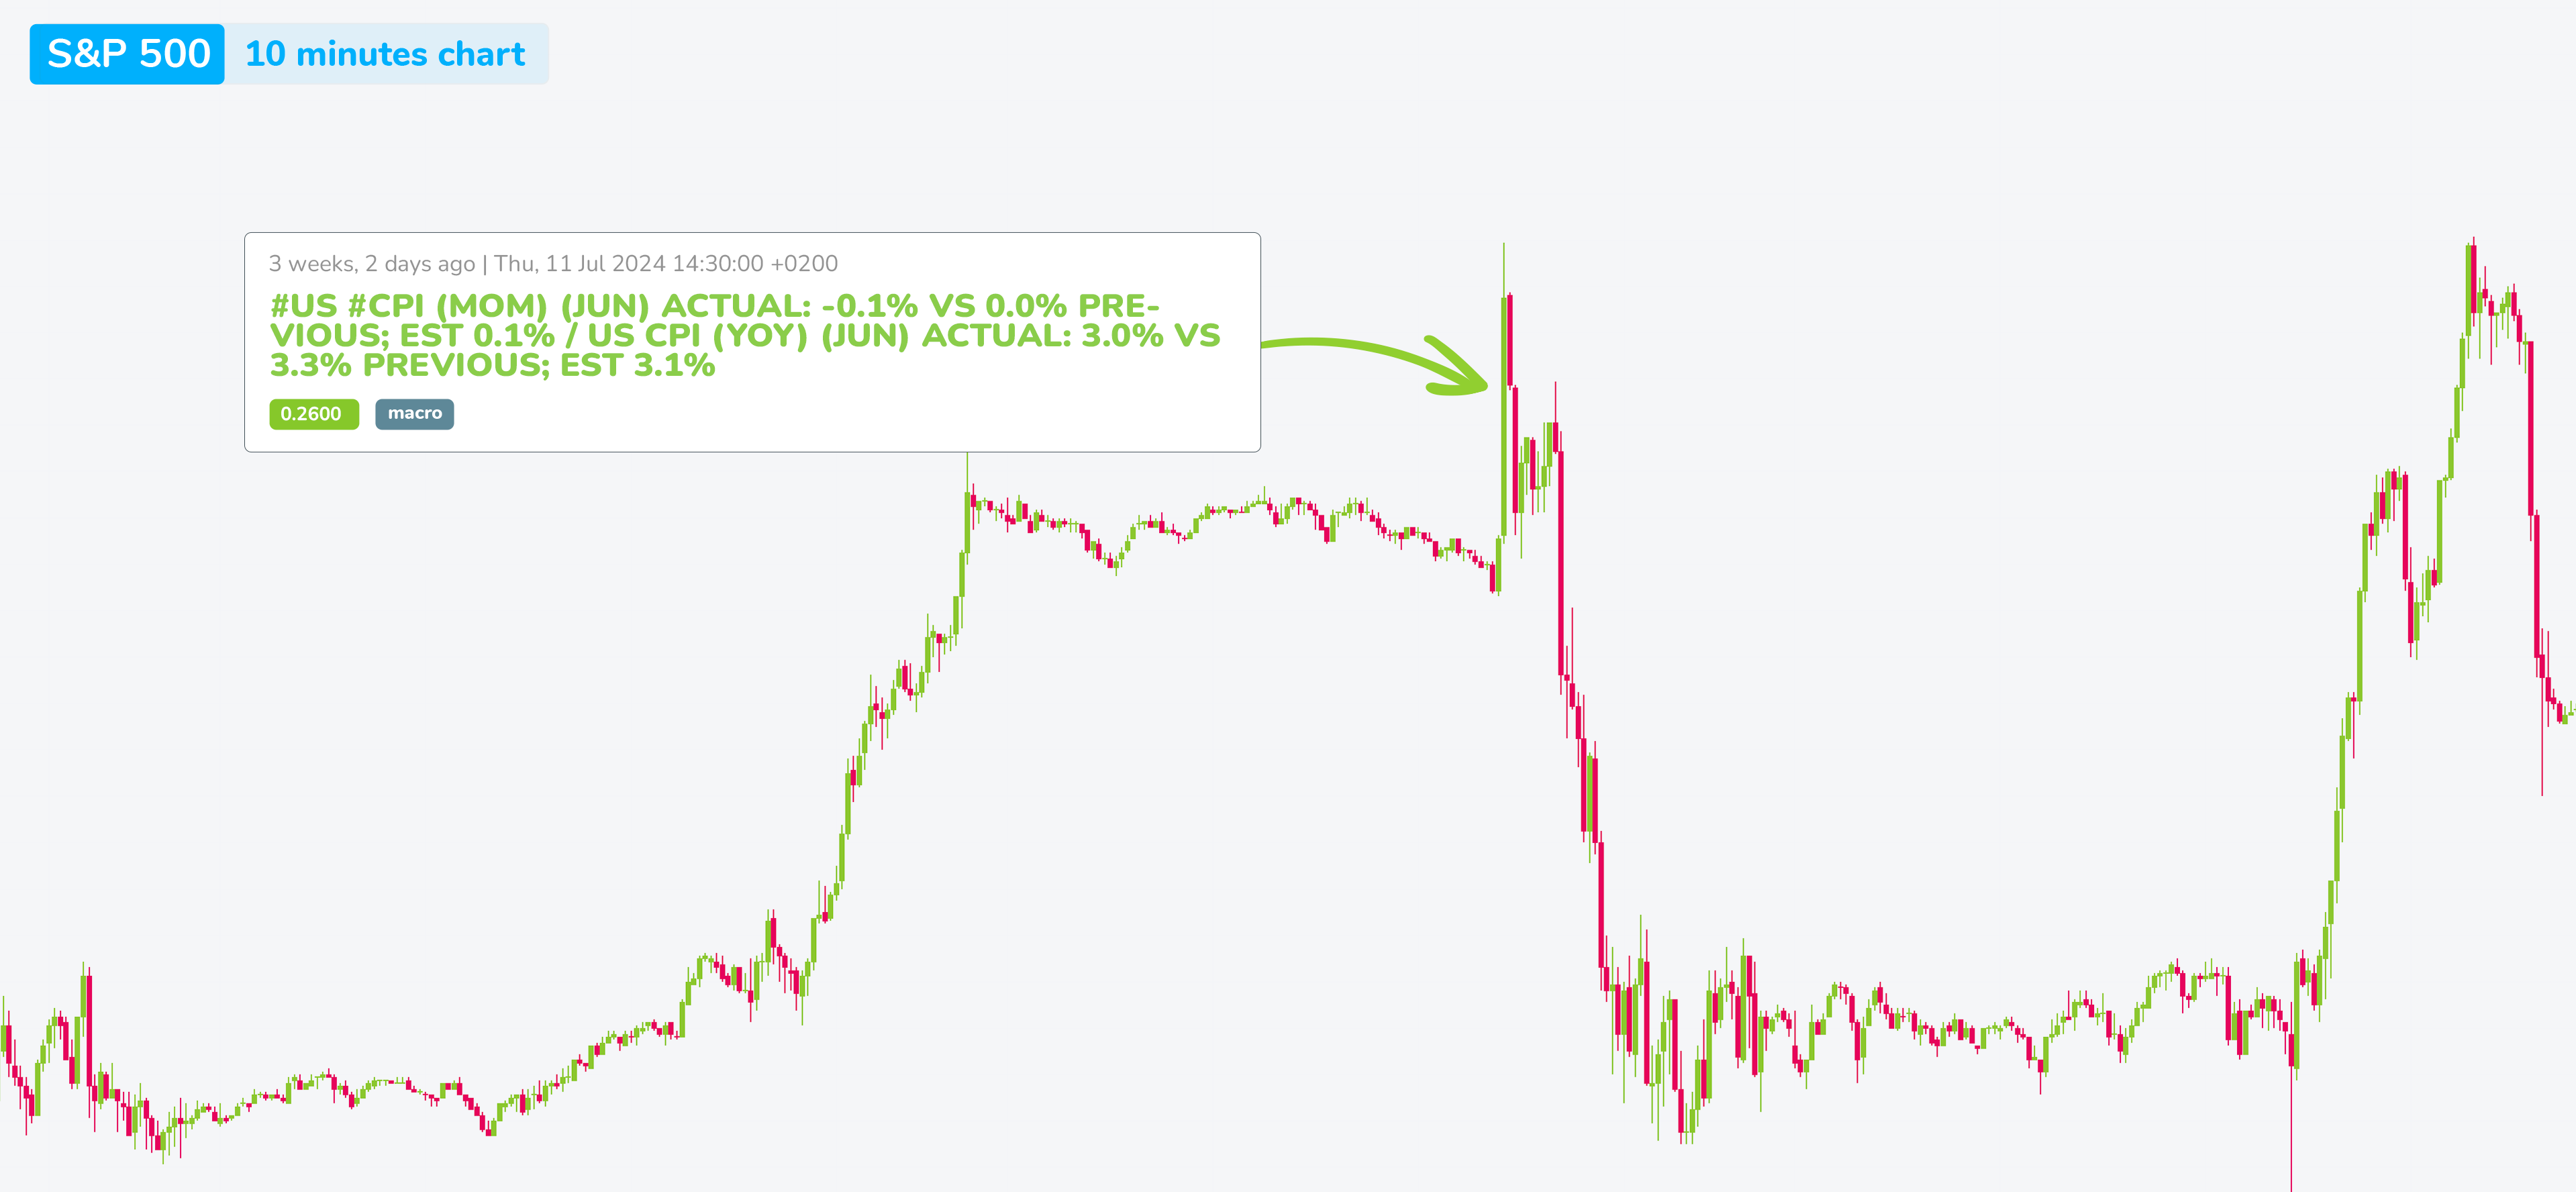
A month later, the drop in inflation indicated by the June CPI on July 11 was even steeper, but the market impact reached only a value of +0.2600. The market, therefore, reacted to a larger drop in inflation with much less enthusiasm than in June. This is because the market always looks further into the future, understanding deeper connections. Such a sharp drop in inflation can also be associated with negative phenomena, such as weaker employment.
Another macro data, adequately illustrating the mentioned change in market perception, are Non-farm payrolls. Since last year’s increase in US interest rates to a pivot, the market reacted positively to the drop in the number of newly opened jobs in the private sector outside of agriculture. From the market’s perspective, this is a sign of the impact of restrictive monetary policy and a precursor to slowing consumer price growth. Conversely, the market reacted negatively to a higher than expected number of new jobs, as it could indicate a still relatively heated labor market, which is unlikely to go hand in hand with a drop in inflation. For example, in the June NFP data, where the labor market showed a growth of 272K compared to the expected 175K. Conversely, the July drop from this value to 206K was received very positively by the market. Simply put, the market for a relatively long period read weaker labor market news positively due to the fight against inflation and vice versa, in the style of “bad news is good news.” This trend reversed, returning to the normal reading of macro by the market, which we could observe at the end of Q2 and the beginning of Q3 in some PMIs. In the NFP, the return to usual macro perception was shown on Friday, August 2nd, when the drop in job openings from the expected 176K to 114K brought a devastating negative market reaction in real fear of an impending nasty US recession.
Generally, the change in the described perception of macro data needs to be read in the context of the market’s shift from the expected soft-landing narrative to the emerging fear of a hard-landing. The market traded in expectation of a soft-landing, moved on in its reading of the fundamentals naturally, fearing a recession.
This reversal from inverse macro reading to the usual perception was one of the defining factors for both the duration of the RiskOn wave and its end. The June drop in inflation brought a crucial boost to the moodix market sentiment indicator, while the July CPI contributed to the positive market sentiment with only about half the positive sentiment portion. A similar situation appeared at the culmination of the RiskOn wave during the release of NFP data on July 5. Sure, a positive report, but with only half the impact compared to earlier releases.
The Moodix index and the derived market sentiment indicator are designed to account for the usual market memory, and strong sentiment tends to dissipate without the necessary impulses in the form of other very strong breaking news. Ongoing sentiment needs continuous new impulses, and in their absence, sentiment weakens and easily comes under pressure upon the arrival of negation.
The market at the end of the RiskOn wave came under pressure from breaking news from other topics, including geopolitics. Let’s mention the war in Ukraine and the related pledge by the President of the European Commission to support Ukraine, which the market perceived as escalatory rhetoric. The Houthis, who continued attacks on ships in the Red Sea area, further complicating transportation and globally affecting prices within supply chains, were not left behind either.
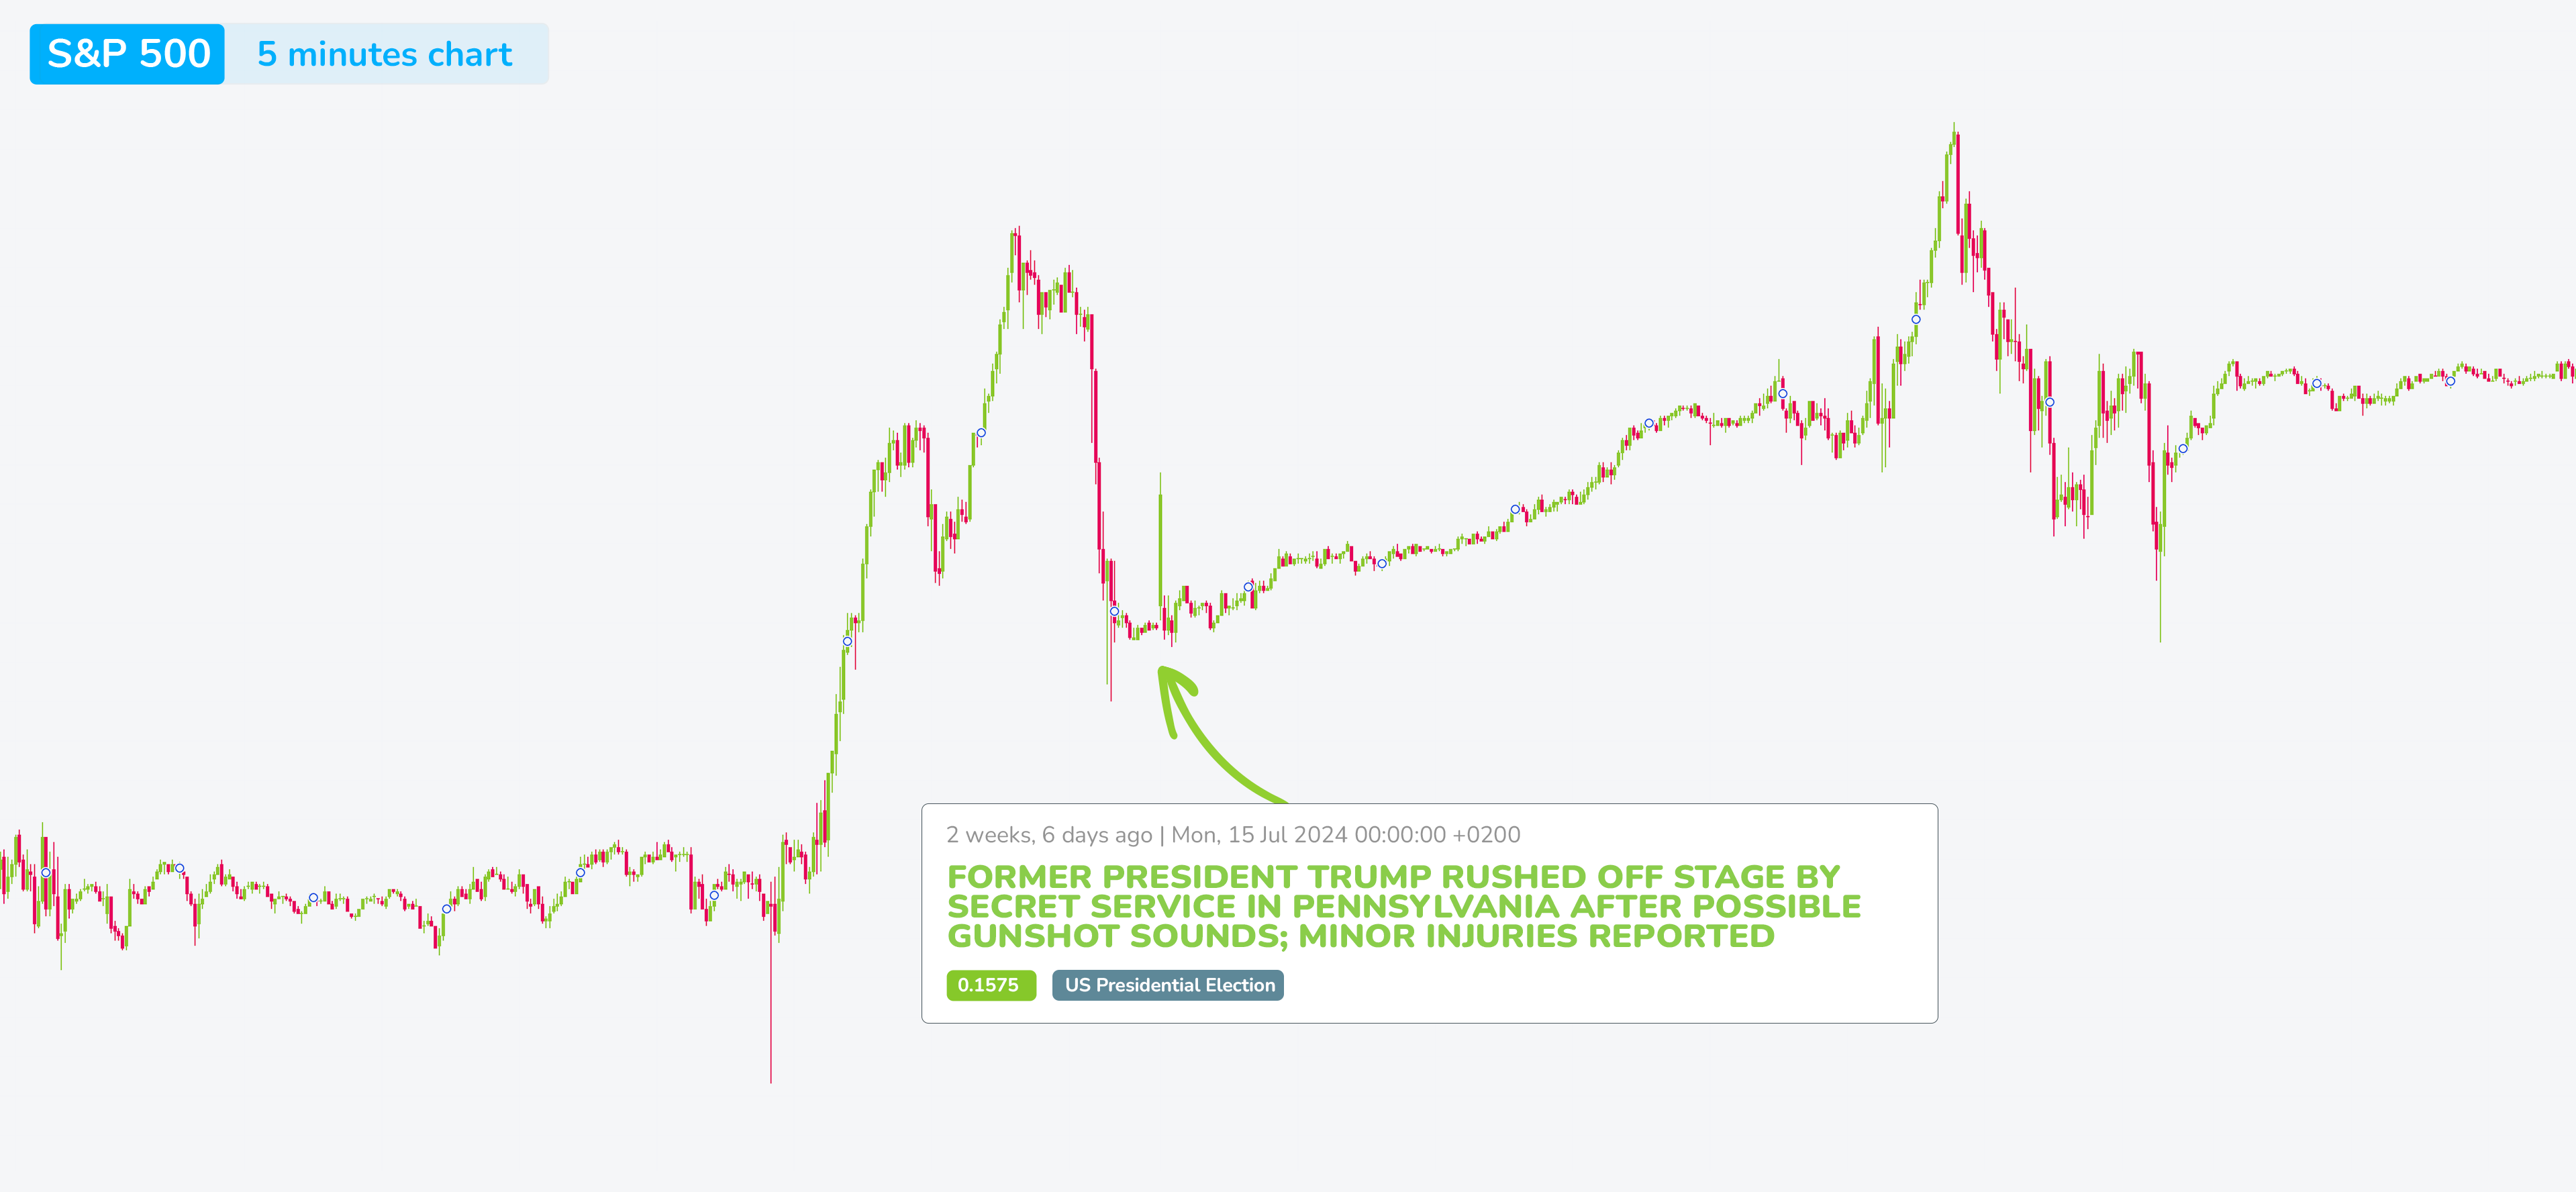
For the first time this year, the US election topic also strongly influenced market events. The first impact was a positive one: in the case of the Republican presidential candidate Trump, when the unsuccessful assassination attempt on him on Saturday, July 13th was received positively by the markets immediately upon their opening on Monday, July 15, which can be marked as the beginning of the so-called Trumptrade.
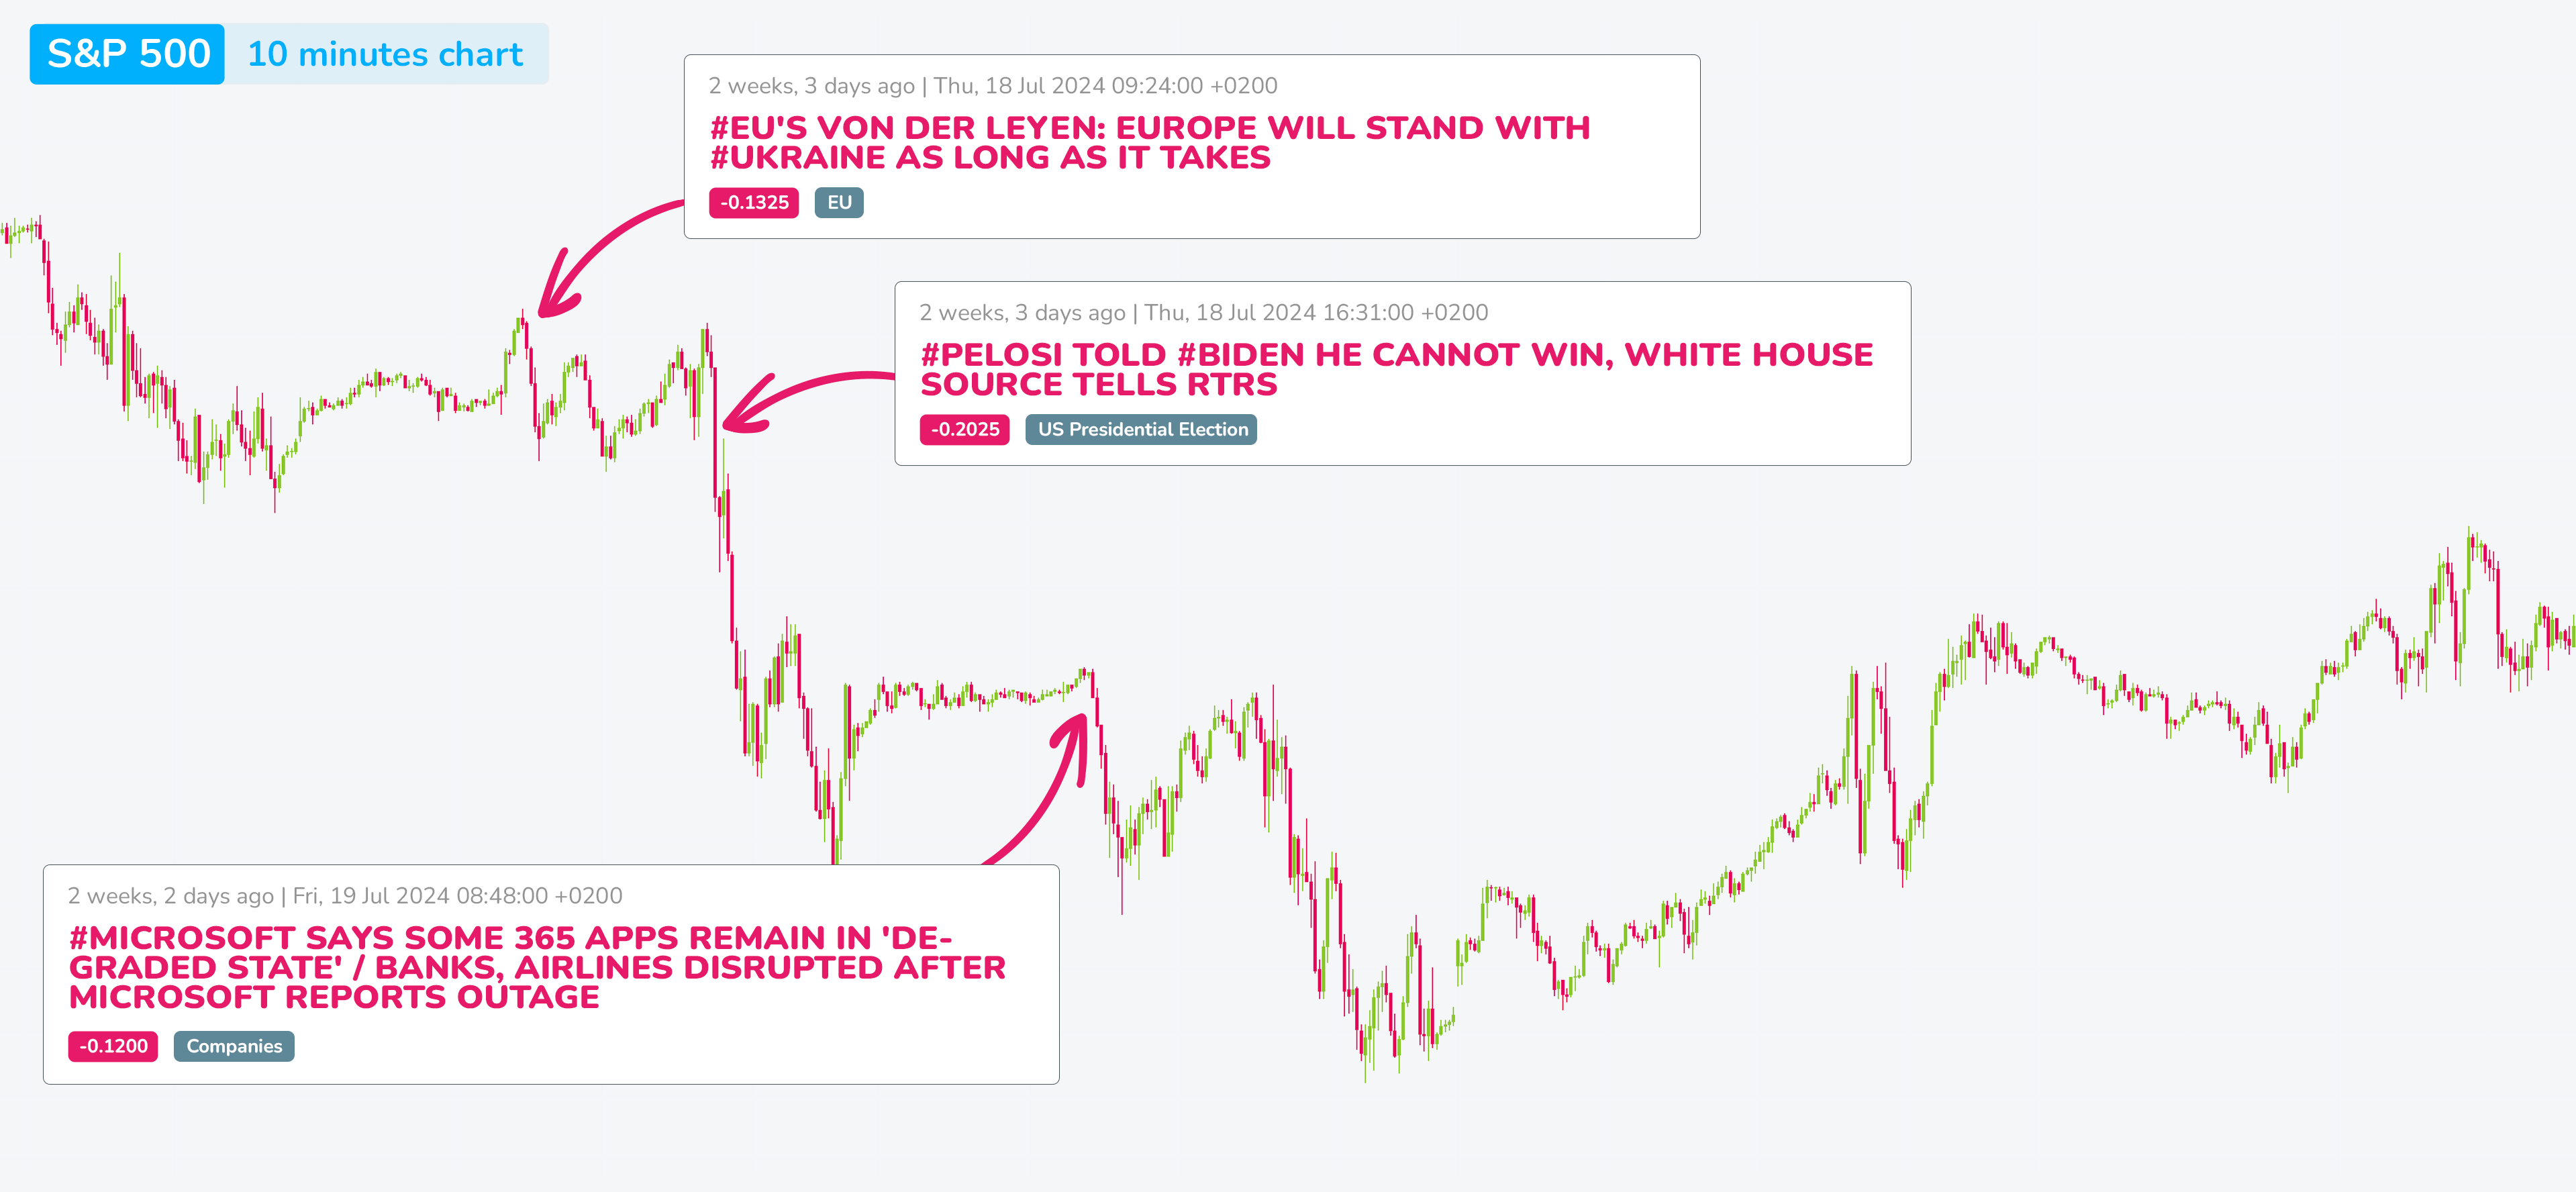
The US election topic ultimately contributed to the end of the RiskOn wave on Thursday, July 18, when the market reacted strongly negatively to the news that former Speaker of the House Nancy Pelosi told Joe Biden that he has no chance of winning this year’s election, which eventually significantly contributed to his decision to withdraw from the position of Democratic presidential candidate. Situations like this, threatening broader instability, are not usually perceived positively by the markets. On the same day, the previously mentioned, negative market statement by von der Leyen about supporting Ukraine also came.
On Friday, August 19, due to an error in the security program updates of Crowdstrike on Microsoft platforms, the markets wavered due to a system outage ensuring, among other things, flight operations, and the RiskOn wave ended.
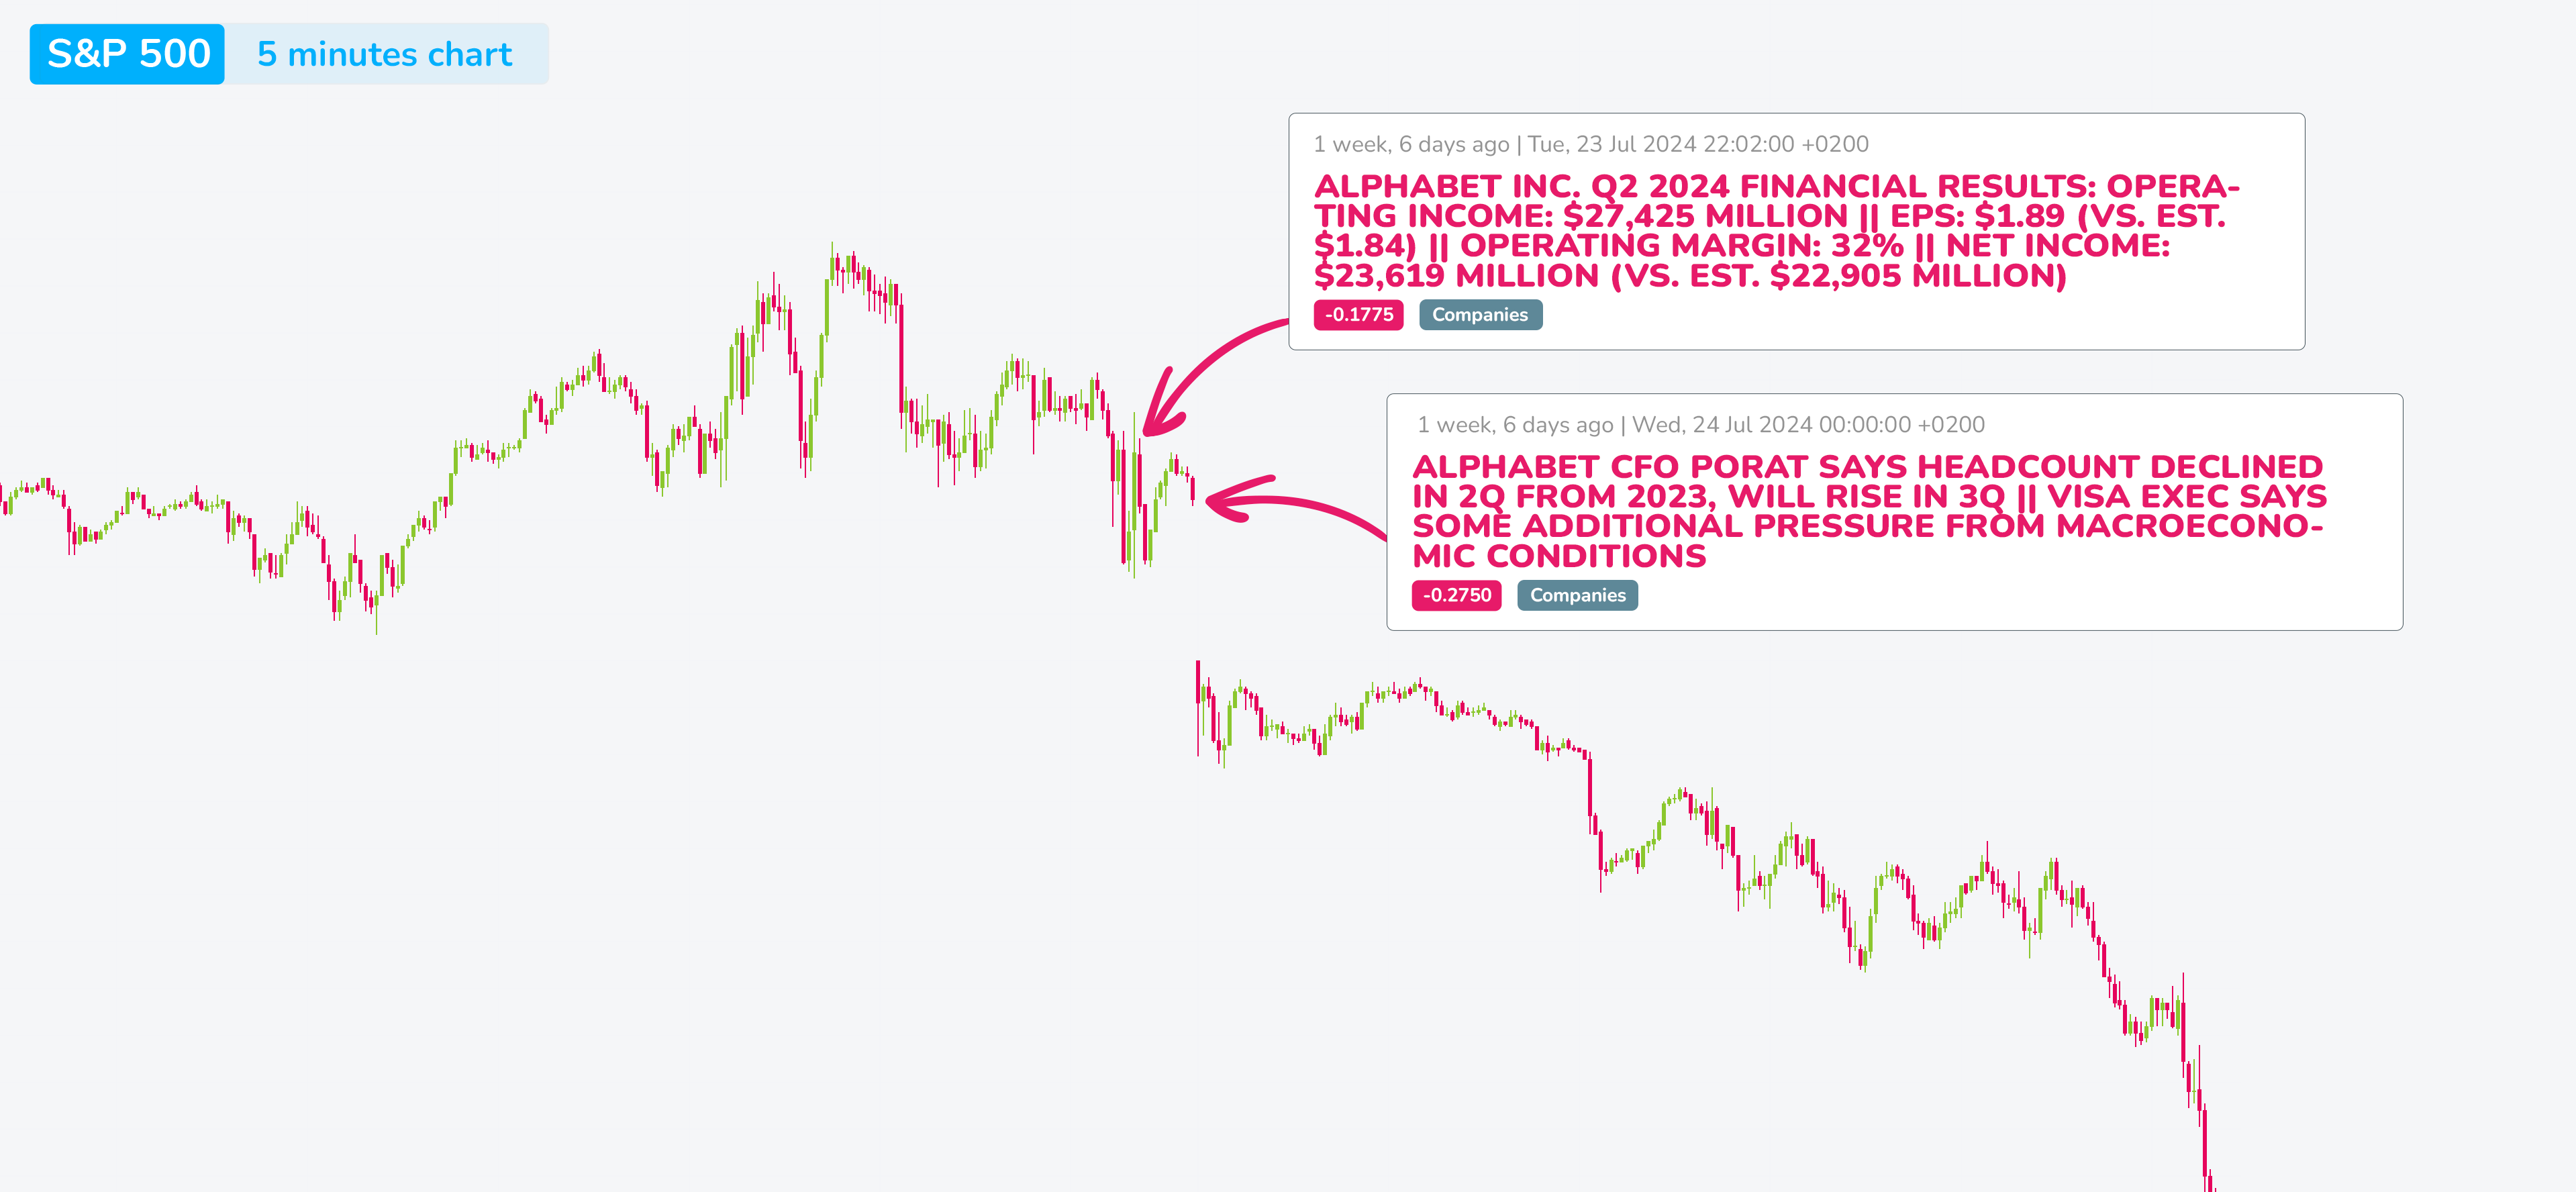
Another factor contributing to the end of RiskOn is another shift in market perception, this time regarding the AI topic, which has caused an unprecedented rally in the technology segment of the SP500 over the past few quarters. However, after the past quarters, the market has shifted its enthusiasm to a more critical view and started to expect the first results indicating massive AI monetization from BIGTECH. The first week of RiskOff sentiment started the BIGTECH earnings season, and this shift in market perception of the AI topic was fully reflected in the reading of Alphabet’s (Google) results. It turned out that delivering results that satisfy the market will not be easy for BIGTECH after multiple rocketing quarters.
An instrument lately developed by moodix that predicted this shift as early as in June is the True Volume Profile of the SP500 and its individual segments. With it, you can quickly gain an understanding of the actual traded liquidity volume in the stocks of all 500 companies.
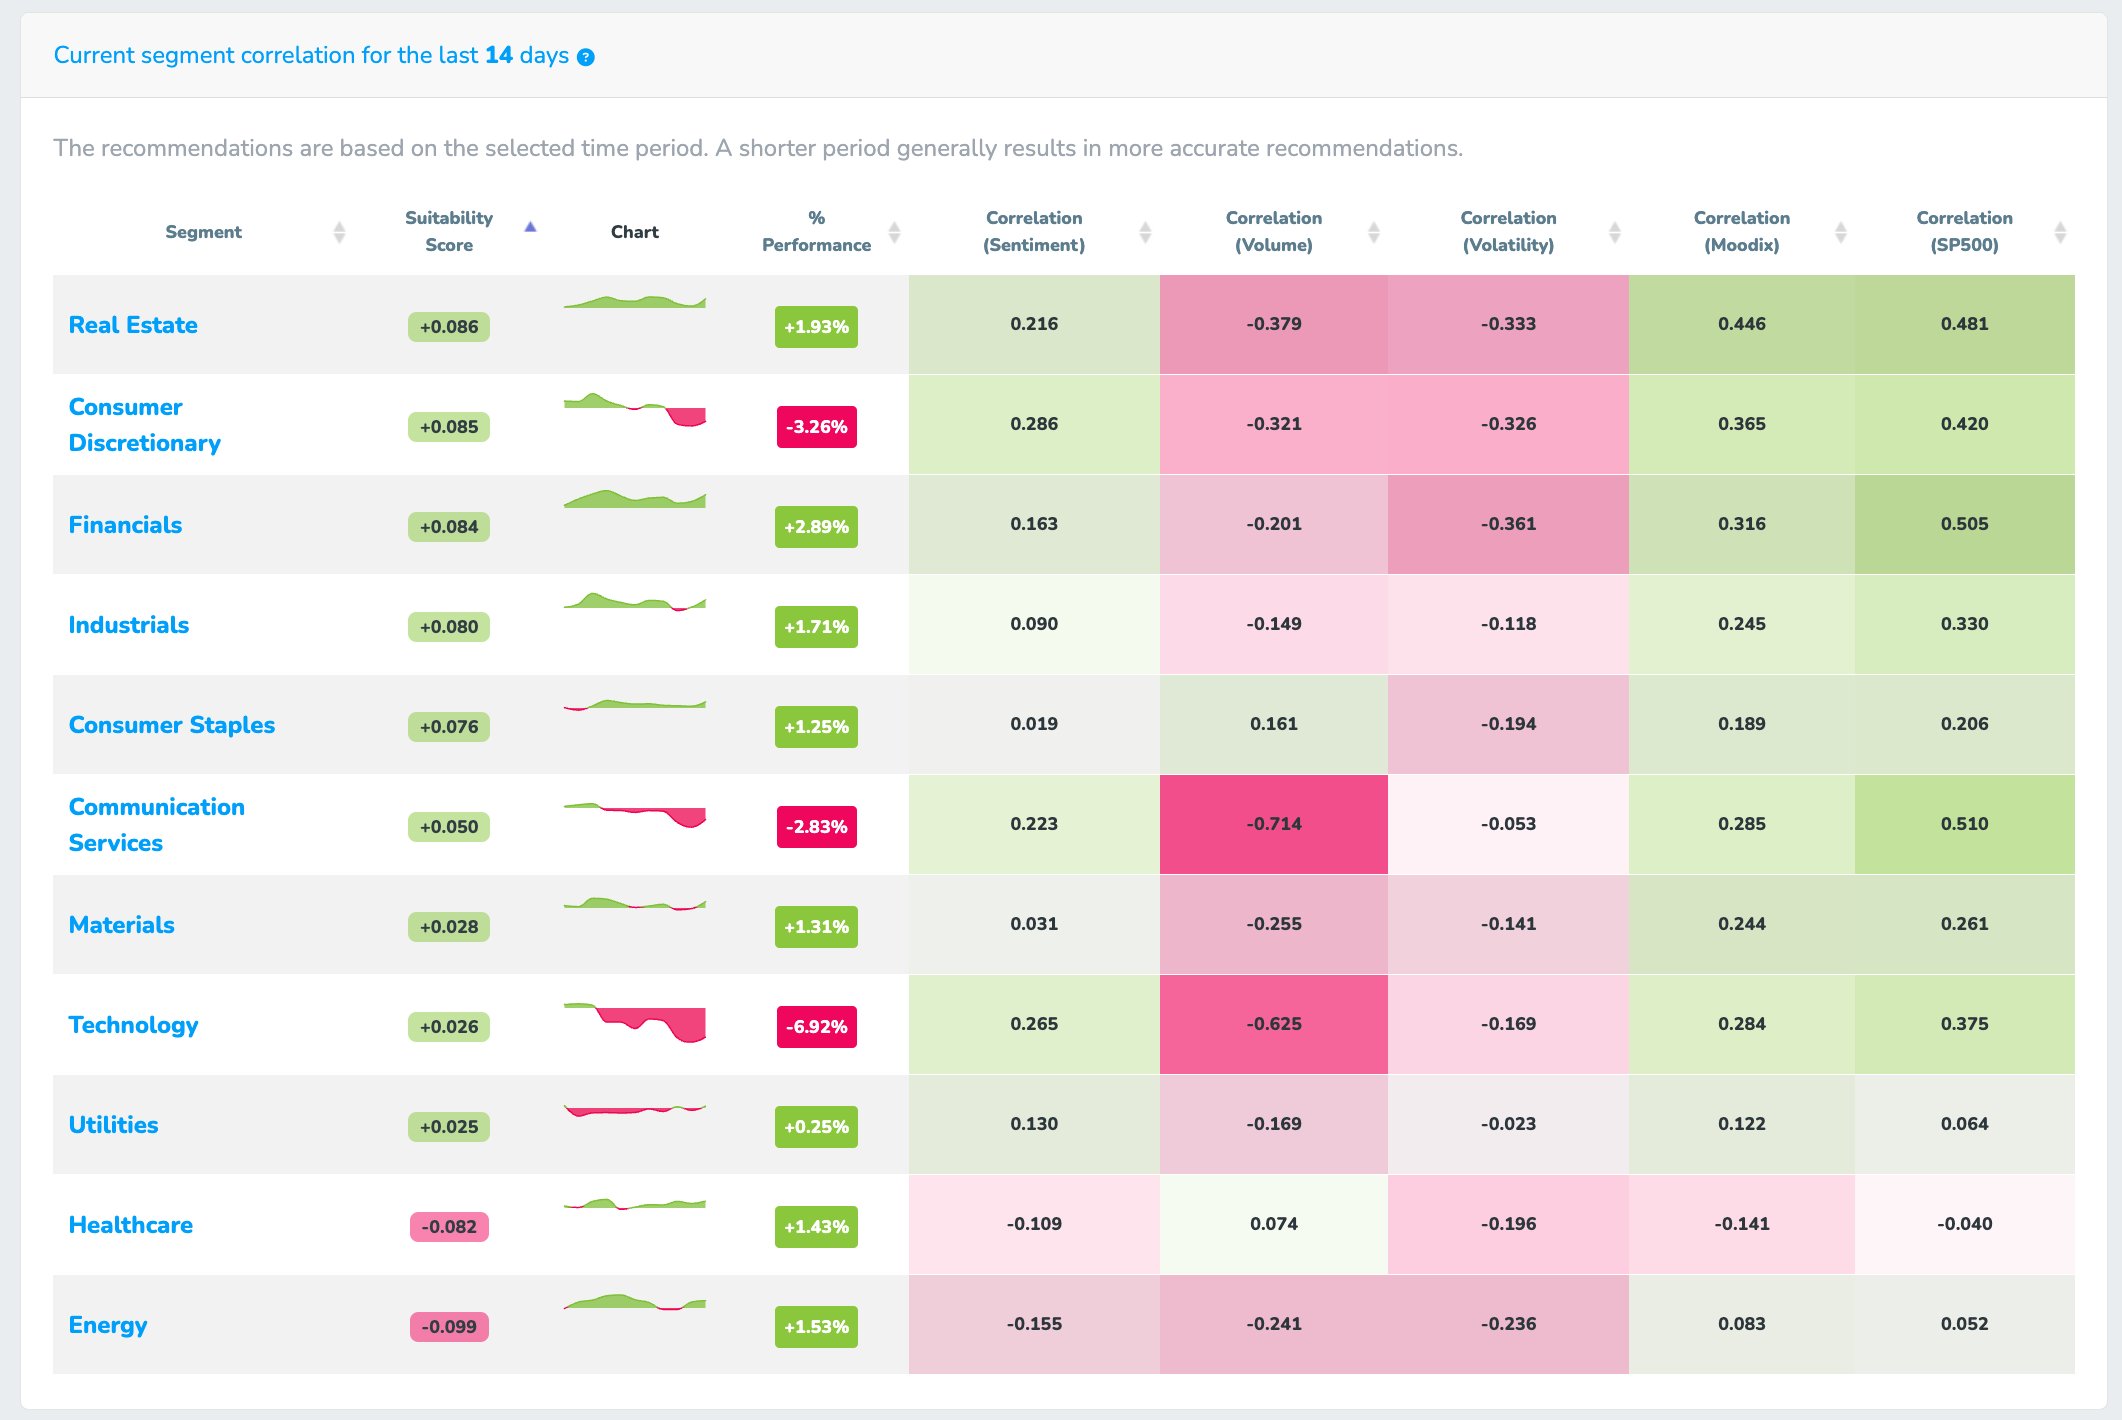
Another crucial tool is the correlation matrix of the SP500 price developments and the prices of its individual segments with Moodix sentiment, the Moodix index, and other Moodix parameters. From June, it became apparent in this matrix that although a solid RiskOn sentiment prevailed, the TECH segment itself weakened significantly in correlation with it (the correlation between its price development and Moodix sentiment gradually decreased), while segments that had previously been overshadowed by the BIGTECH rally, such as Real Estate, started to correlate convincingly with the positive market sentiment.
We will be preparing a more detailed explanatory text on the True Volume Profile and the correlation matrix, focusing on the practical use of this data.
Please take a look at the detail of market sentiment wave and more in the moodix web app, in waves of mood section.
Do not forget you can try moodix web app for free in 7 – days free trial!
