Long-term time frames
Interpretation of measured market sentiment in weekly and daily time frames
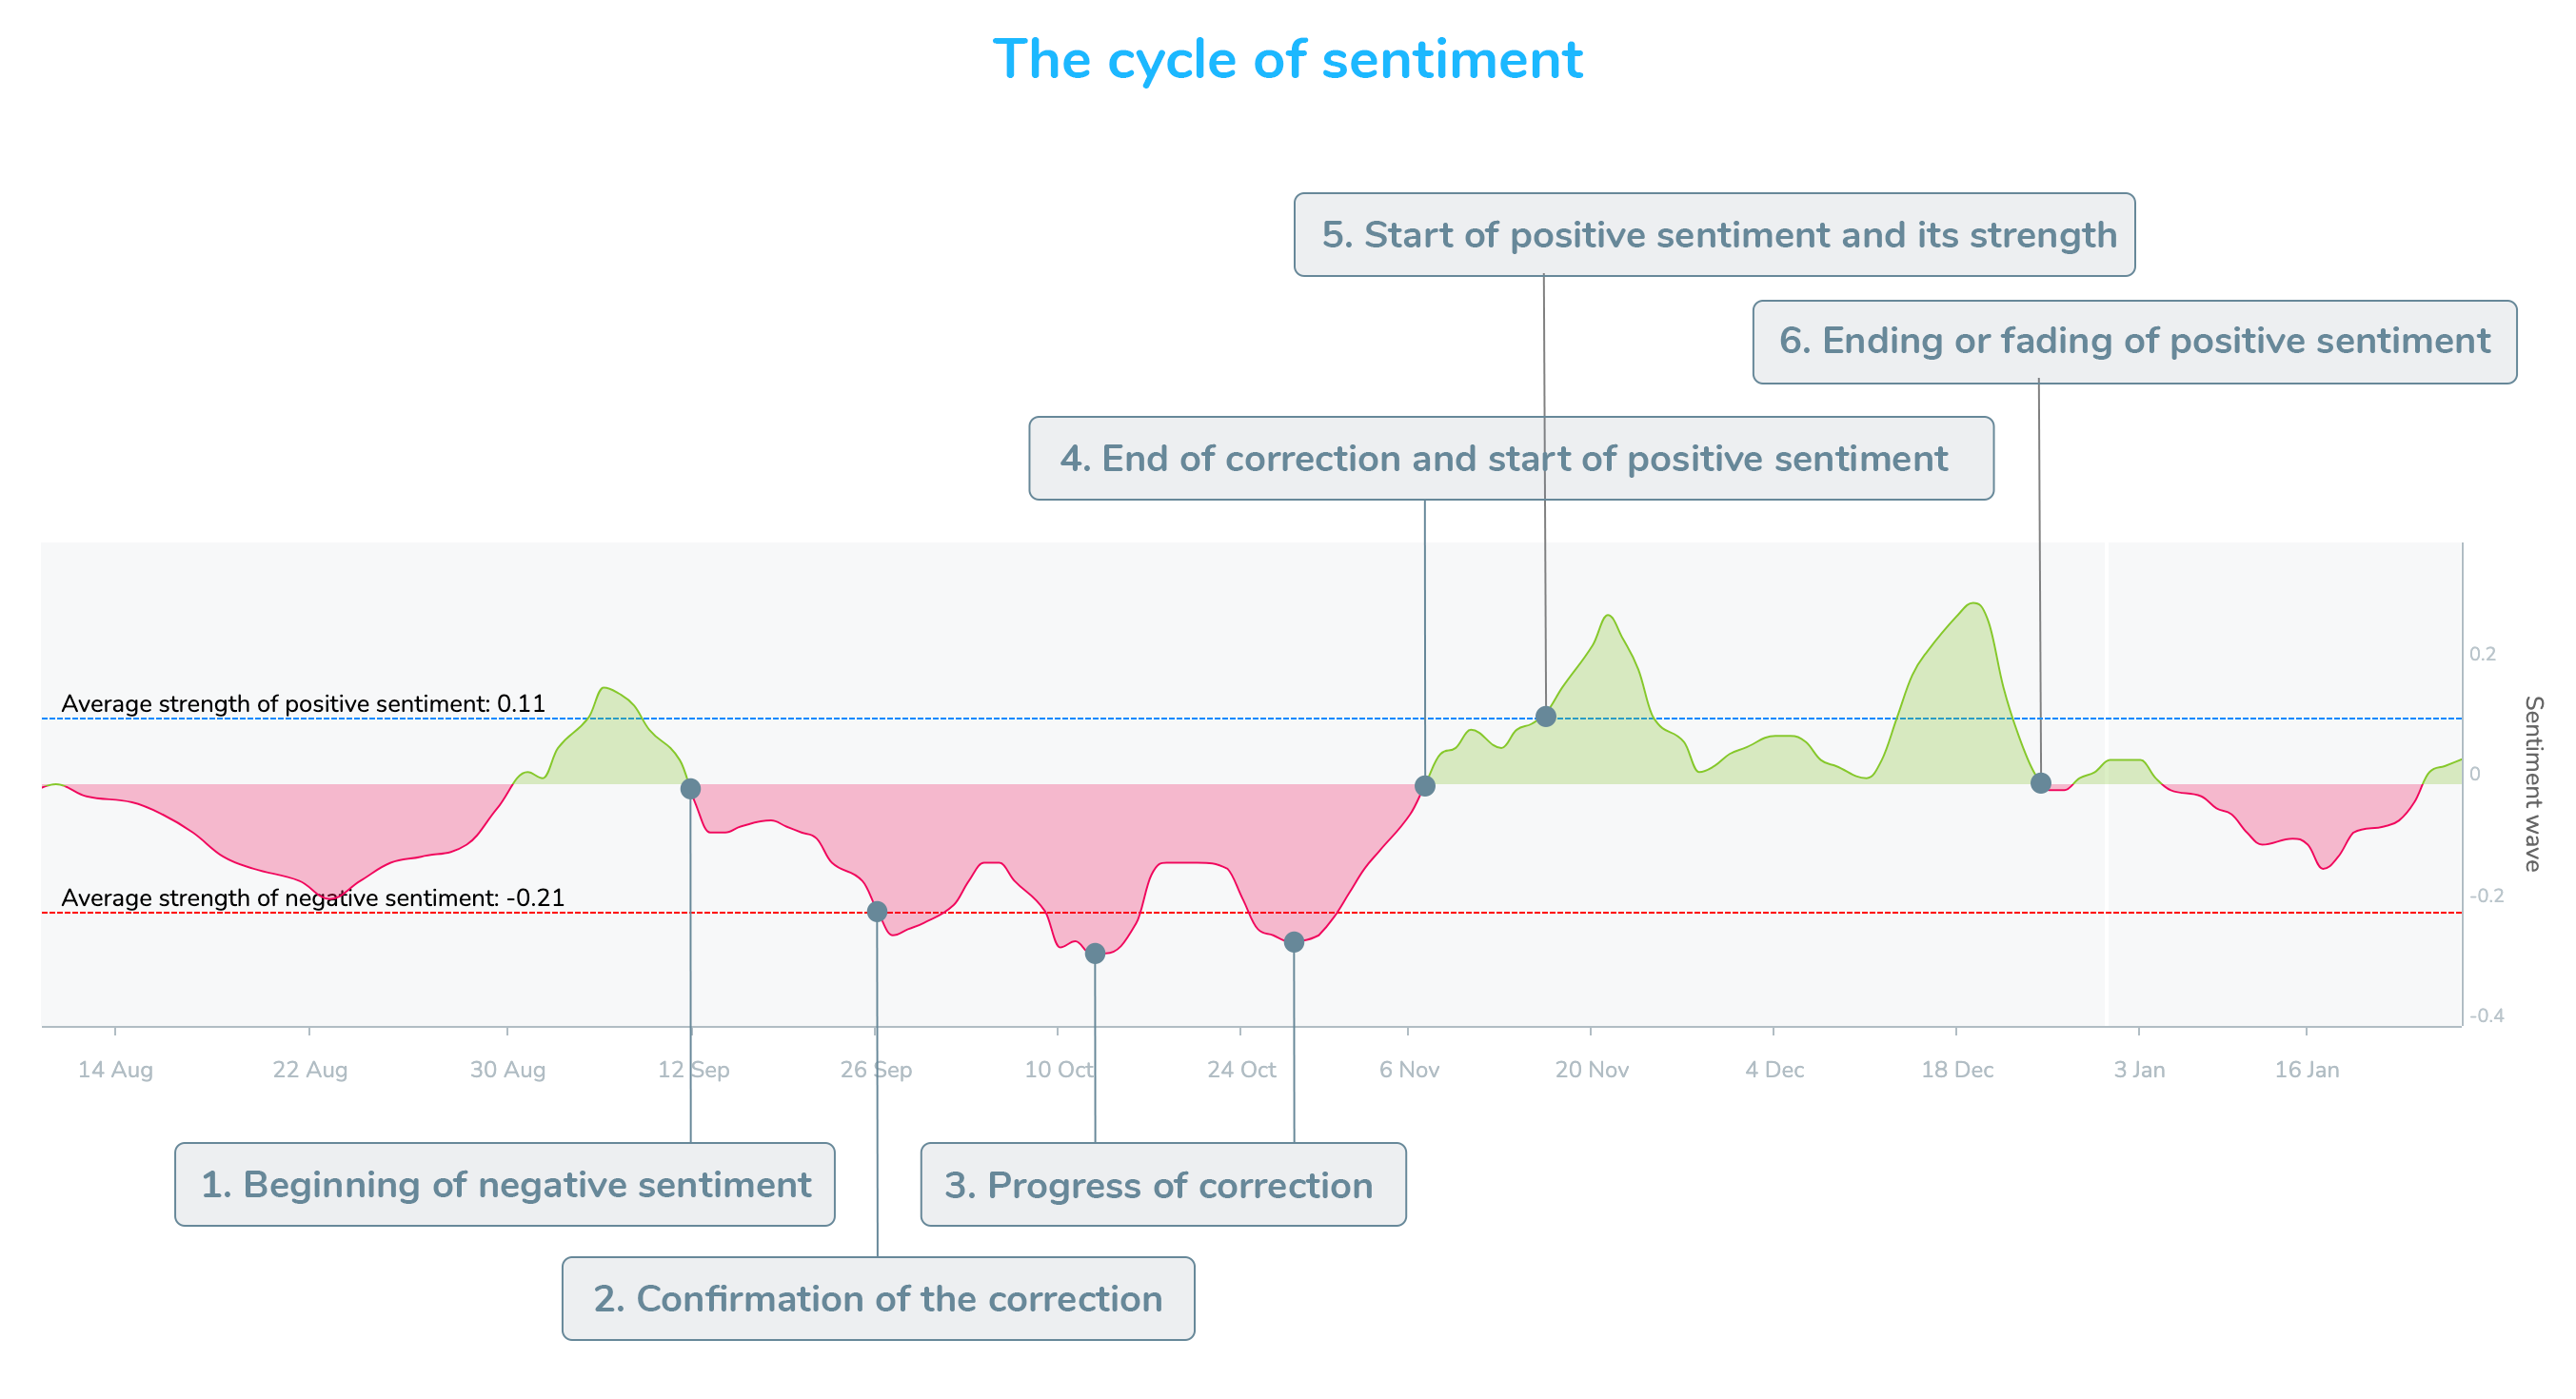
When trading in long-term frames, opportunities for meaningful capital allocation are sought, i.e., entering a long position at a relatively lower price after a decline in the price of the financial instrument, in our case, the SP500 (ES). This price decline is usually preceded by a continuous deterioration of sentiment, which, in most cases, occurs as a result of macroeconomic developments or geopolitical events. Since we carefully measure these events in Moodix, we can define the beginnings and especially changes (reversals) of sentiment with a certain probability.
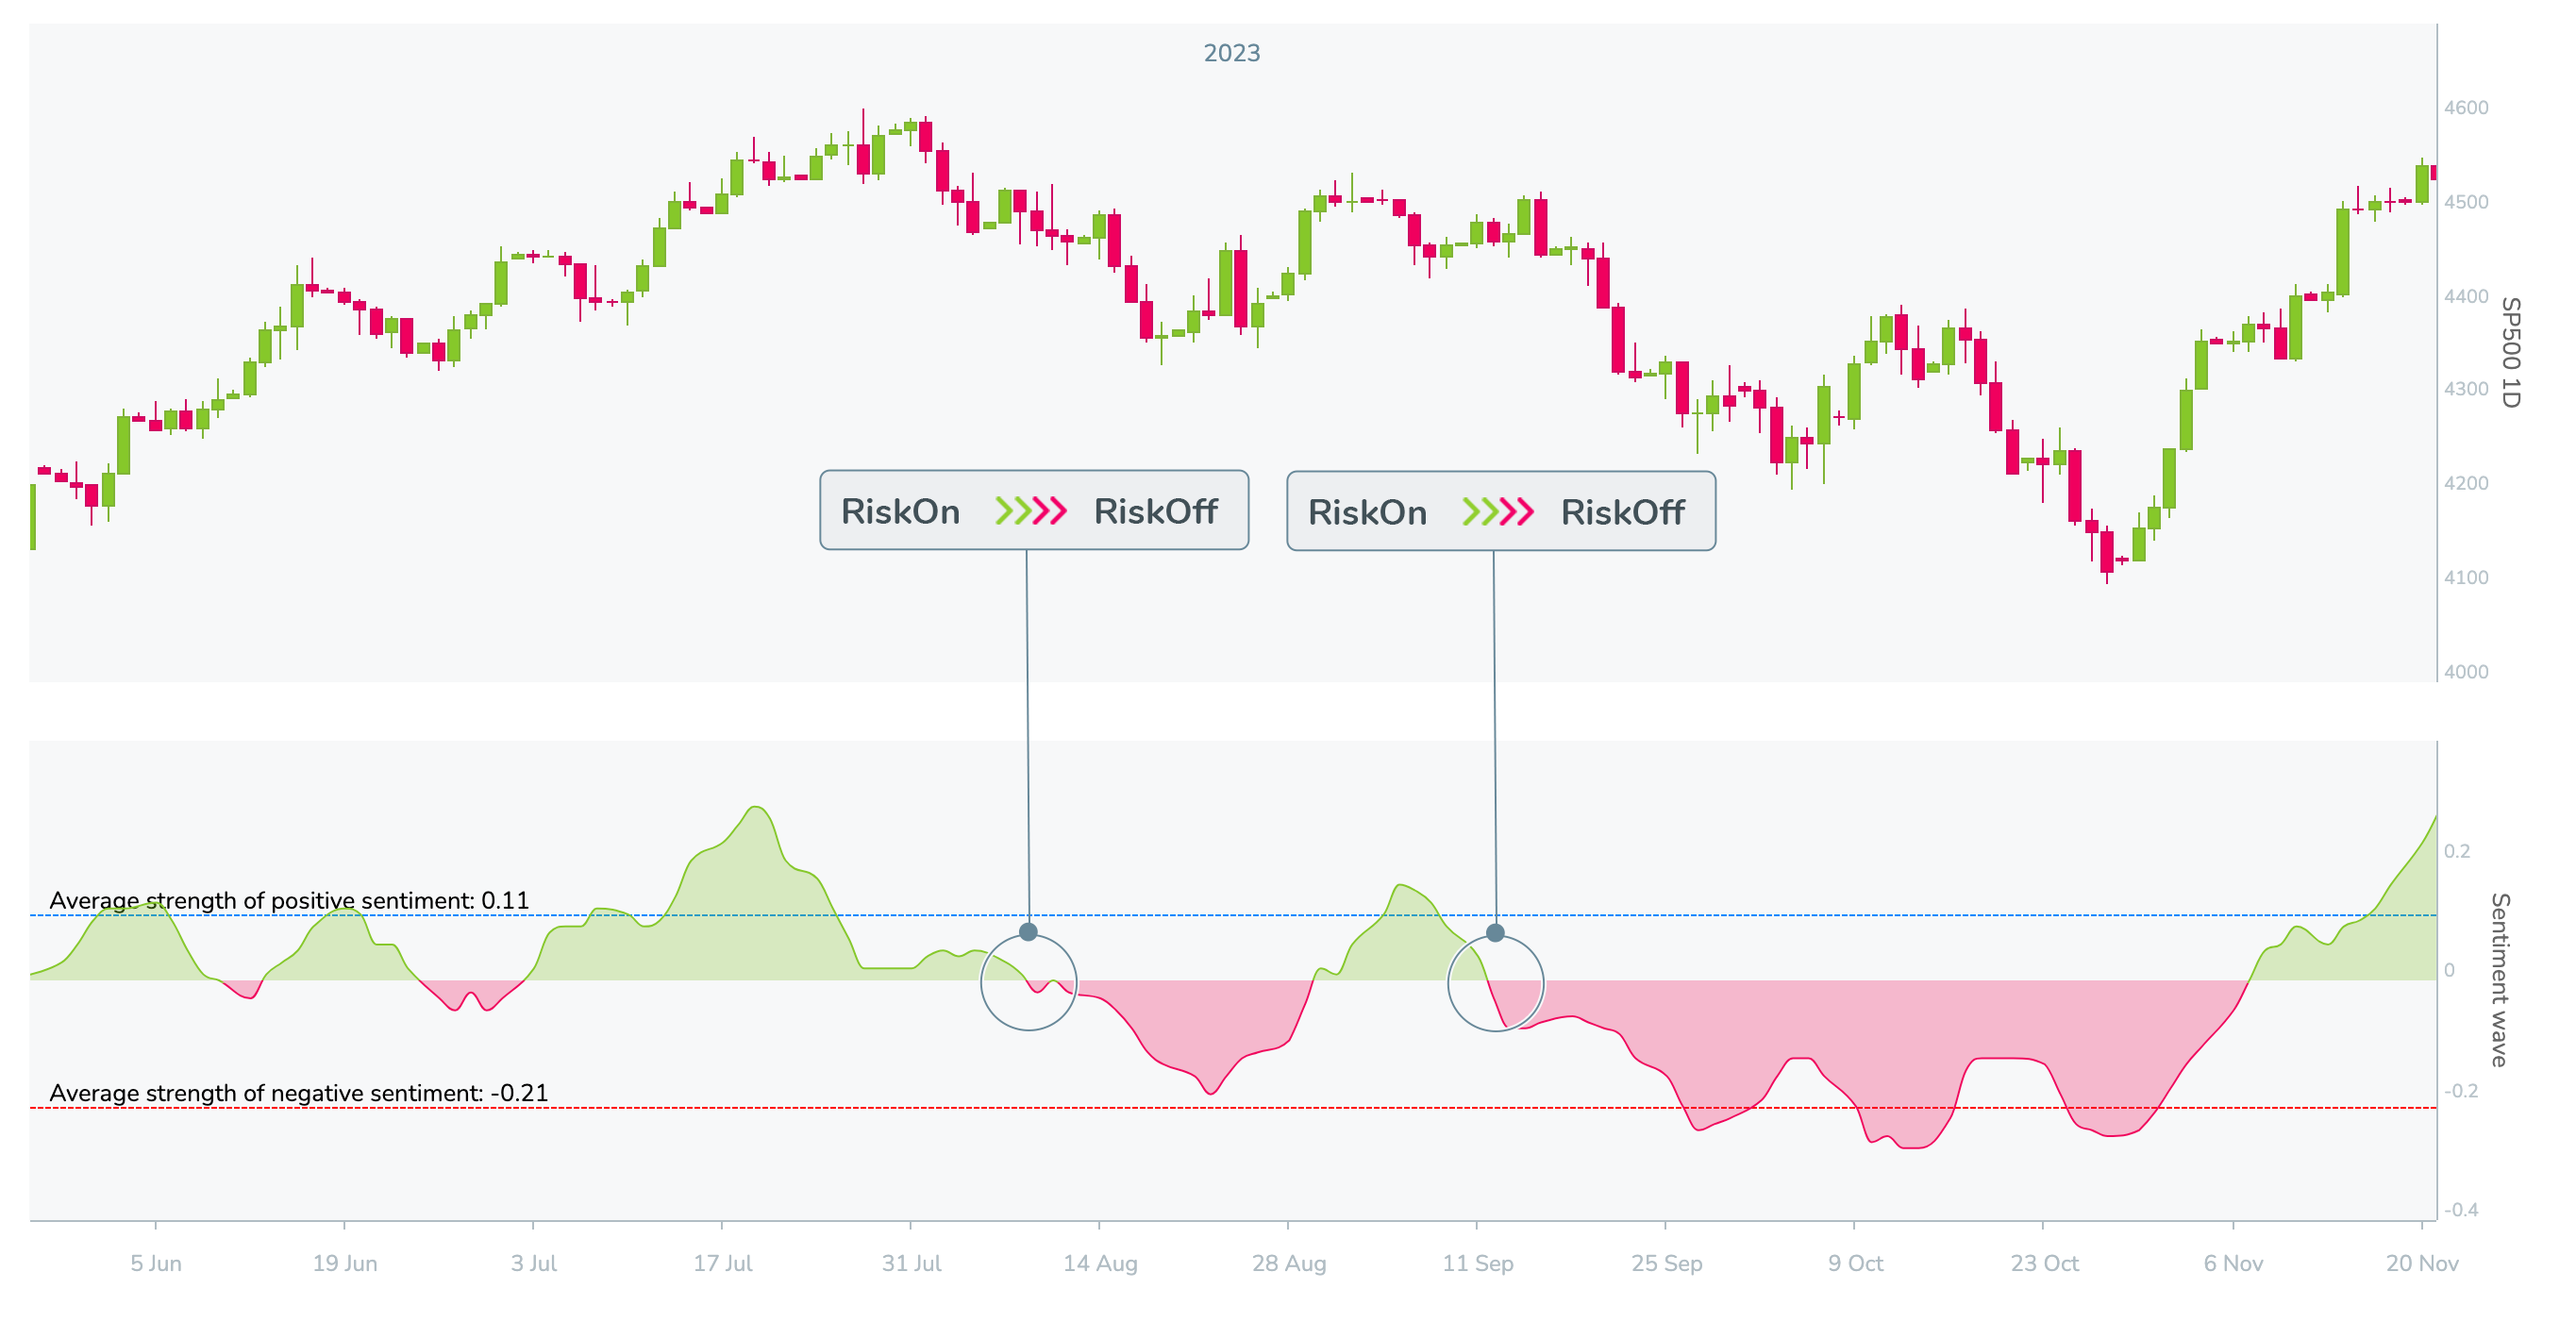
Now, let’s look at the entire market cycle through the lens of empirically measured market sentiment. From the weakening of positive RiskOn sentiment, through the onset of negative RiskOff to its culmination, which in 95% of cases accompanies a significant price decline (correction) to the dissipation of negative sentiment and the arrival of a new RiskOn wave, which when intensifying, culminating into expansionary territory indicates the beginning of a market rally.
This description should be understood only as an illustrative example of what is a market cycle, as the market and market sentiment do not develop logically and linearly in reality but rather chaotically and unpredictably. Understanding this cycle can fundamentally help when it comes to capital allocation in a way that significantly increases the chance of success.
1. Beginning of negative sentiment
Positive sentiment ends at the moment when market sentiment reaches negative values.
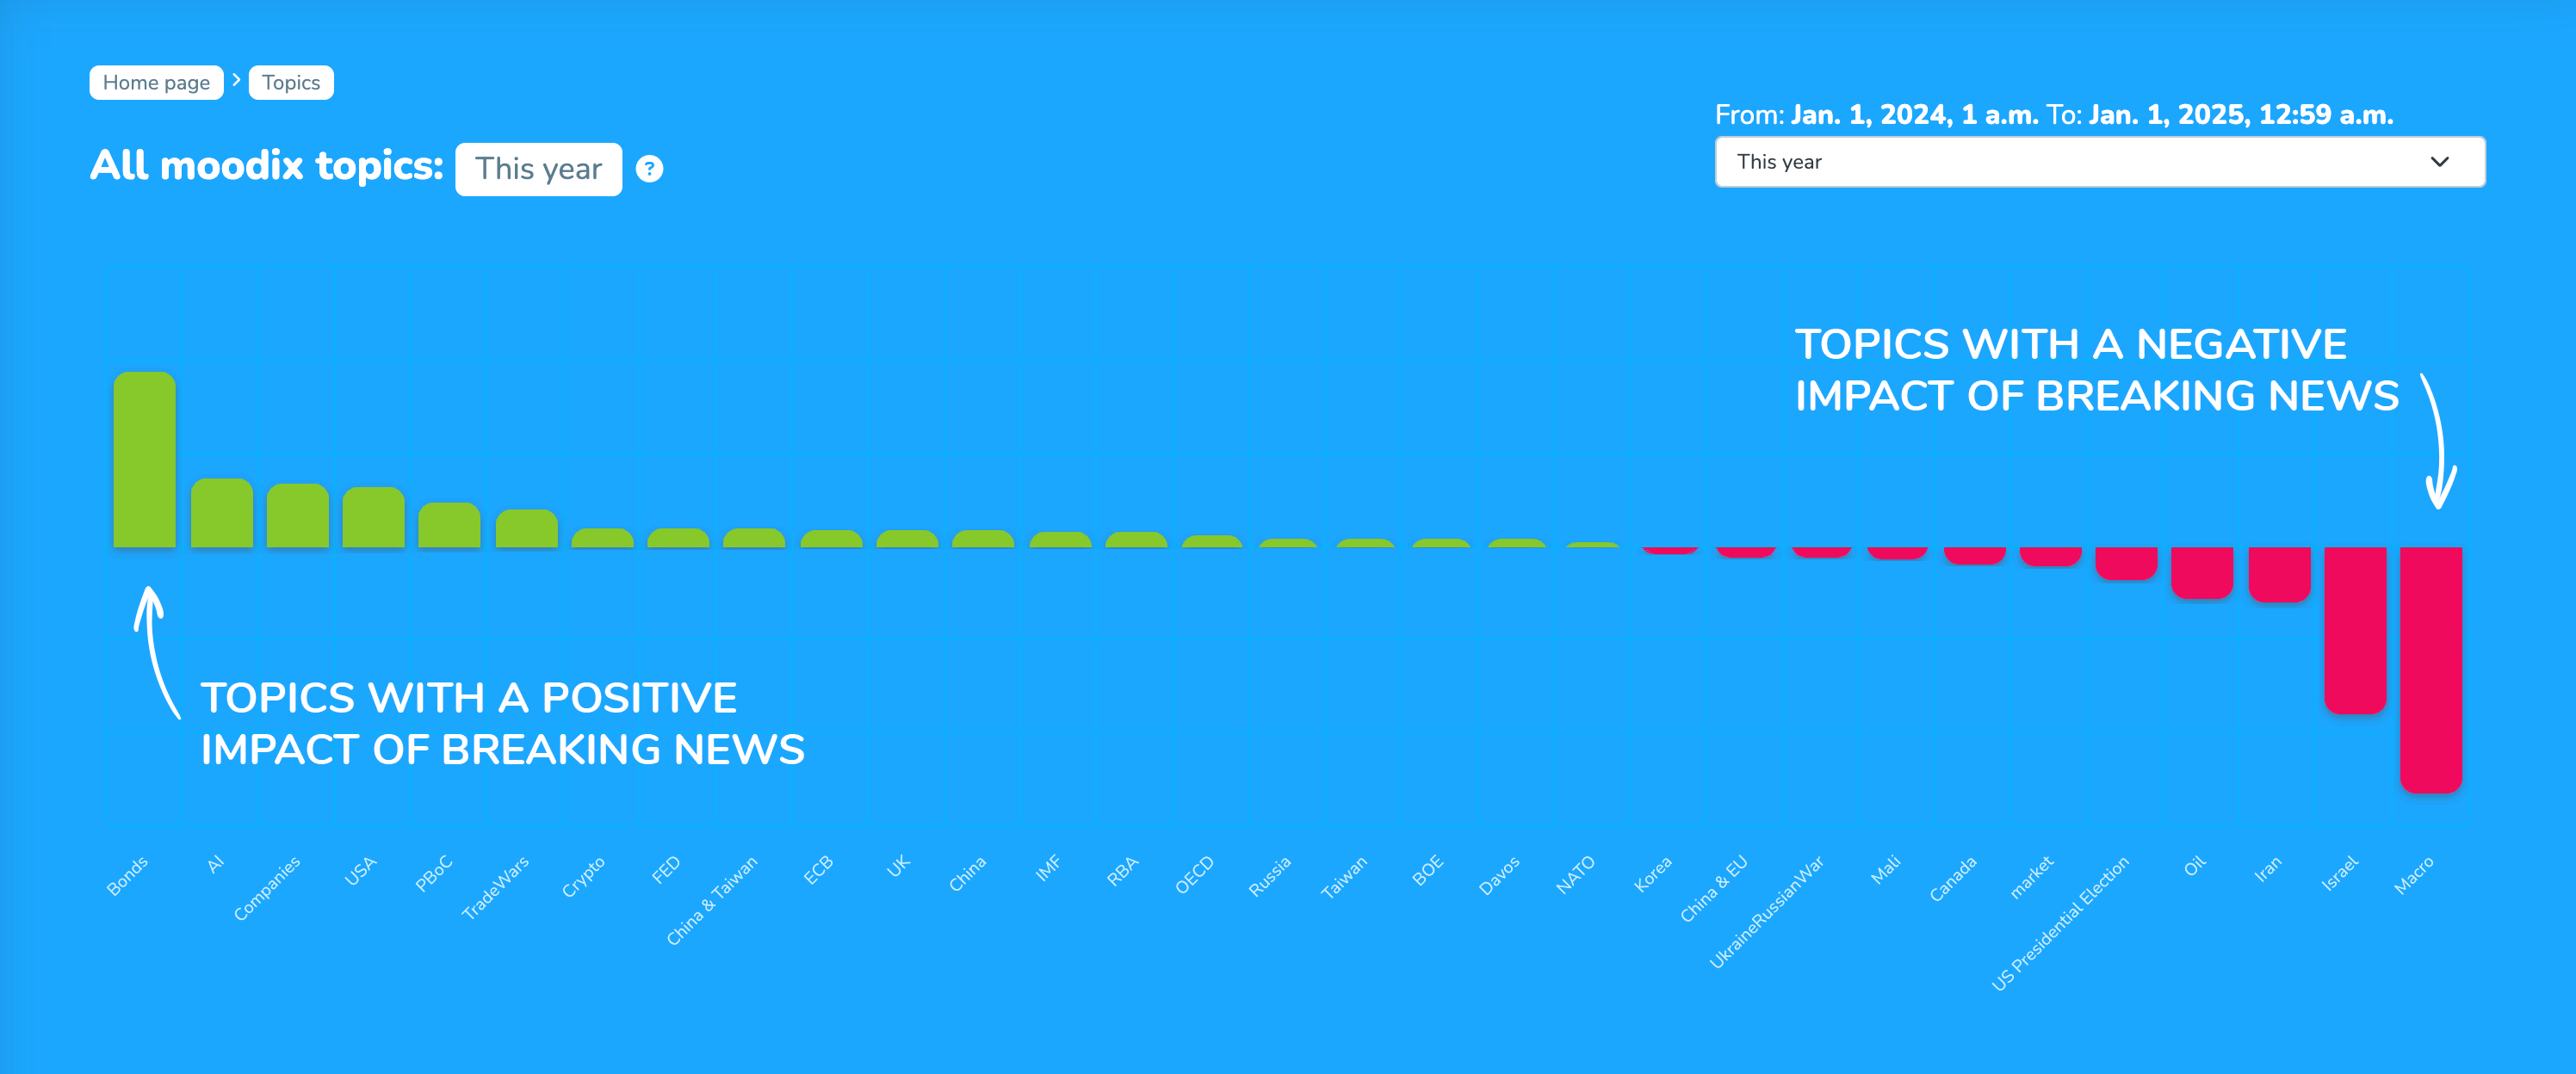
It is the result of a predominance of negative news and the market tends to defend its positions. It doesn’t have to be the start of a substantial price drop, rather we can observe a test of what the market can bear. It always depends on the essence of the news this negative sentiment is triggered by. Sometimes, it is a one-off geopolitical issue (e.g. terrorist attacks, rhetorical escalation) or a long-term problem (war in Ukraine, Covid, inflation). By categorizing individual news into topics, we can track their separate development and the strength of their pressure on the markets.
In Moodix, we follow individual themes and quite accurately know what exactly brought the market into negative sentiment, the so-called “beginning of the correction”.
2. Confirmation of the correction
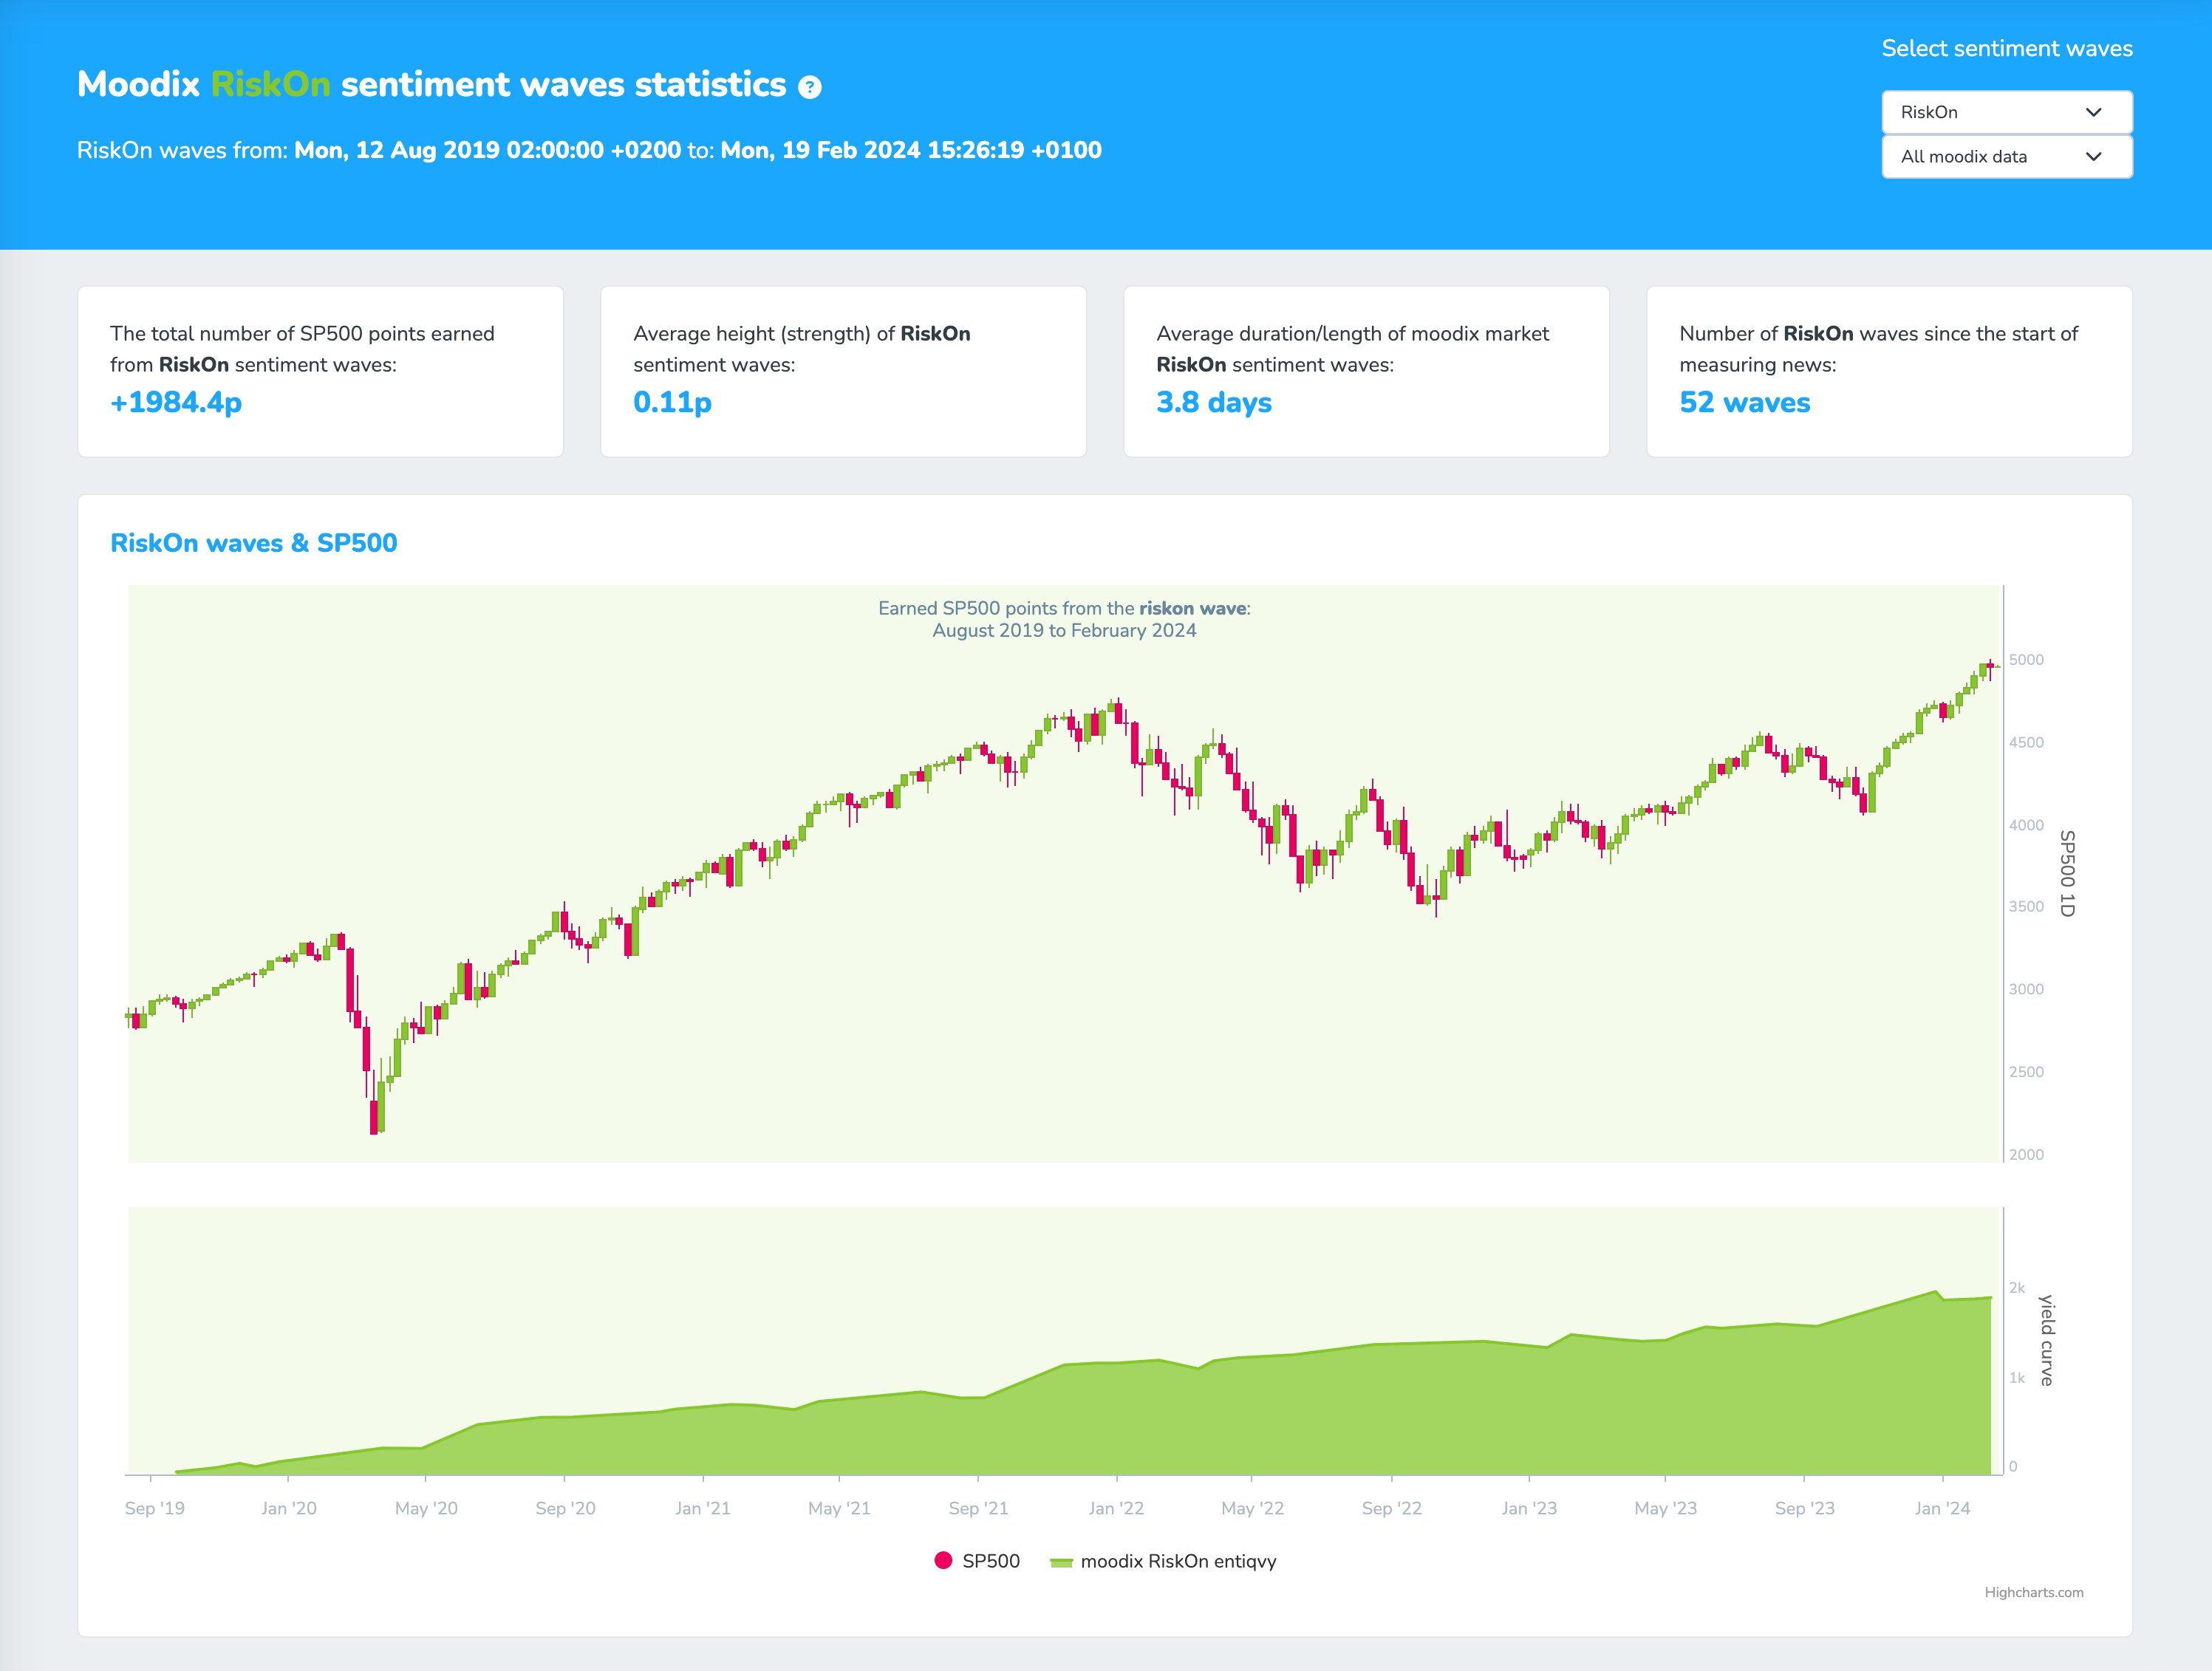
The confirmation of a market correction is a crucial aspect for every RiskOff wave. Most corrections, in fact, end right at the beginning and the market absorbs the negative sentiment. You can see the statistics of individual sentiment waves here.
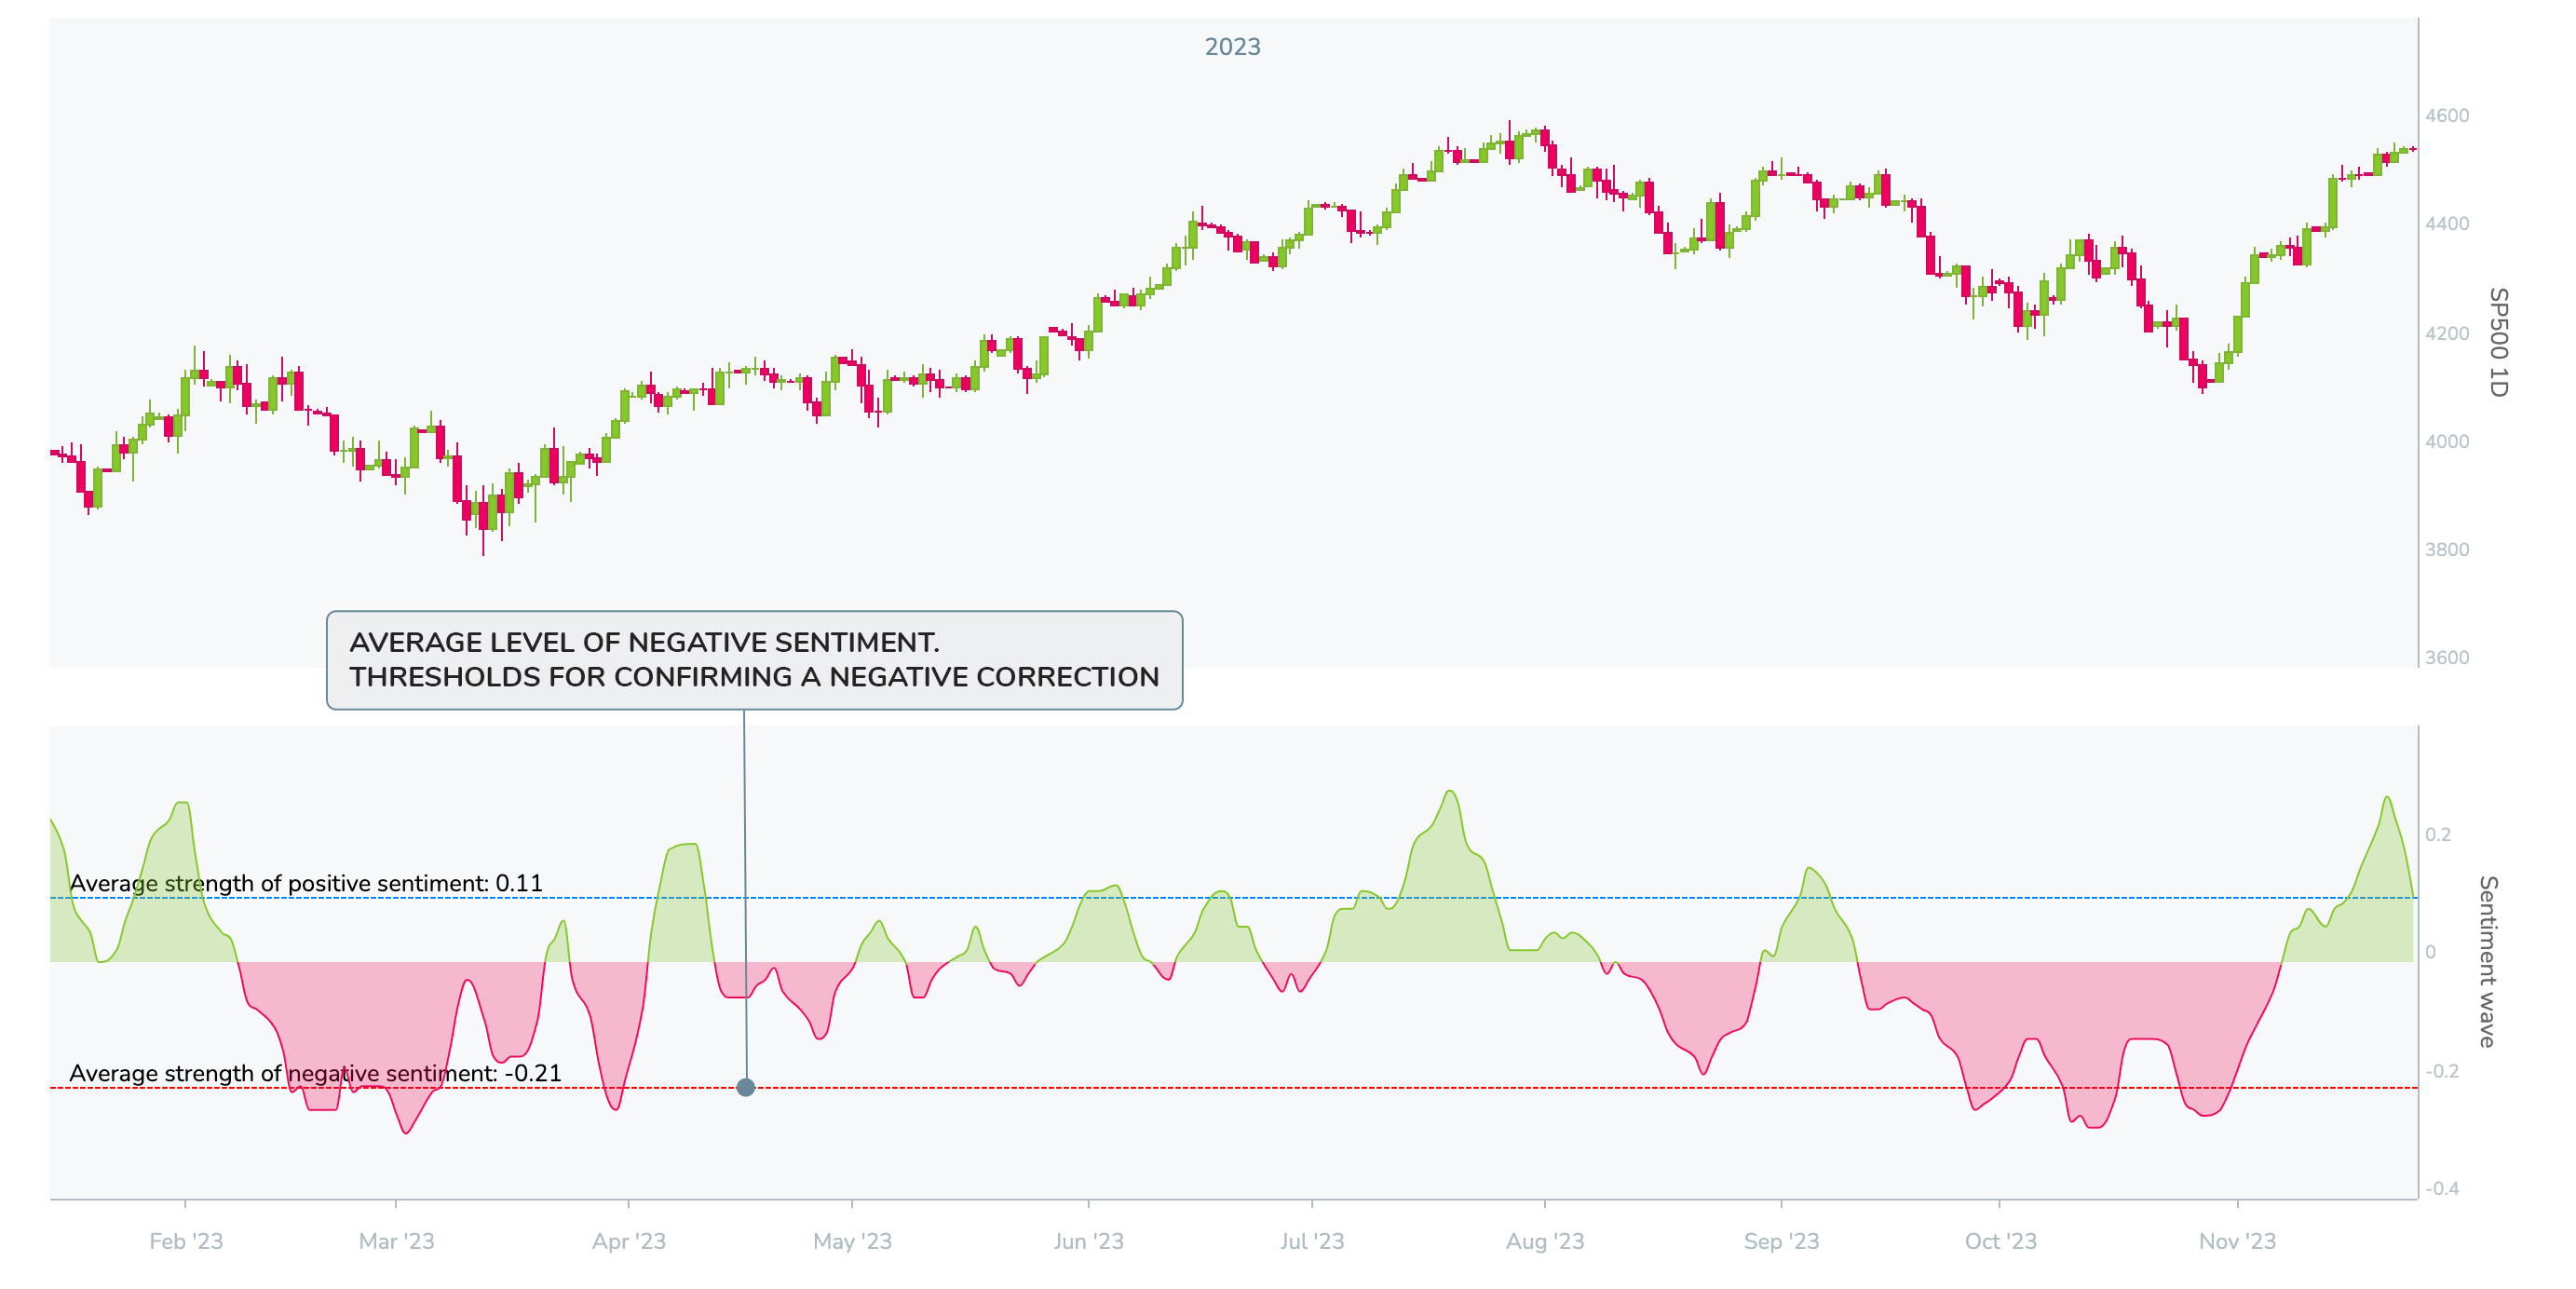
The confirmation of a correction is based on the long-term average depth of negative waves. The average for a negative wave is -0.21 points with a deviation of +-0.02 points. As you can see here or in the picture below, the average strength of negative waves works fairly well as a threshold for serious state of sentiment and stronger corrections always come after the sentiment value exceeds this average. Upon reaching/exceeding this level and the beginning of the correction, we generally speak about a negative environment, a term that can be used in medium-term and short-term time frames as well.
As you can see in the graph, the sentiment encountered many minor attempts at corrections that the market just absorbed and did not create any new buying opportunities. On the other hand, the large negative waves (after reaching the average level) provide much more interesting opportunities.
3. Progress of correction
We mainly follow the progress of the correction on the sentiment calculation chart.
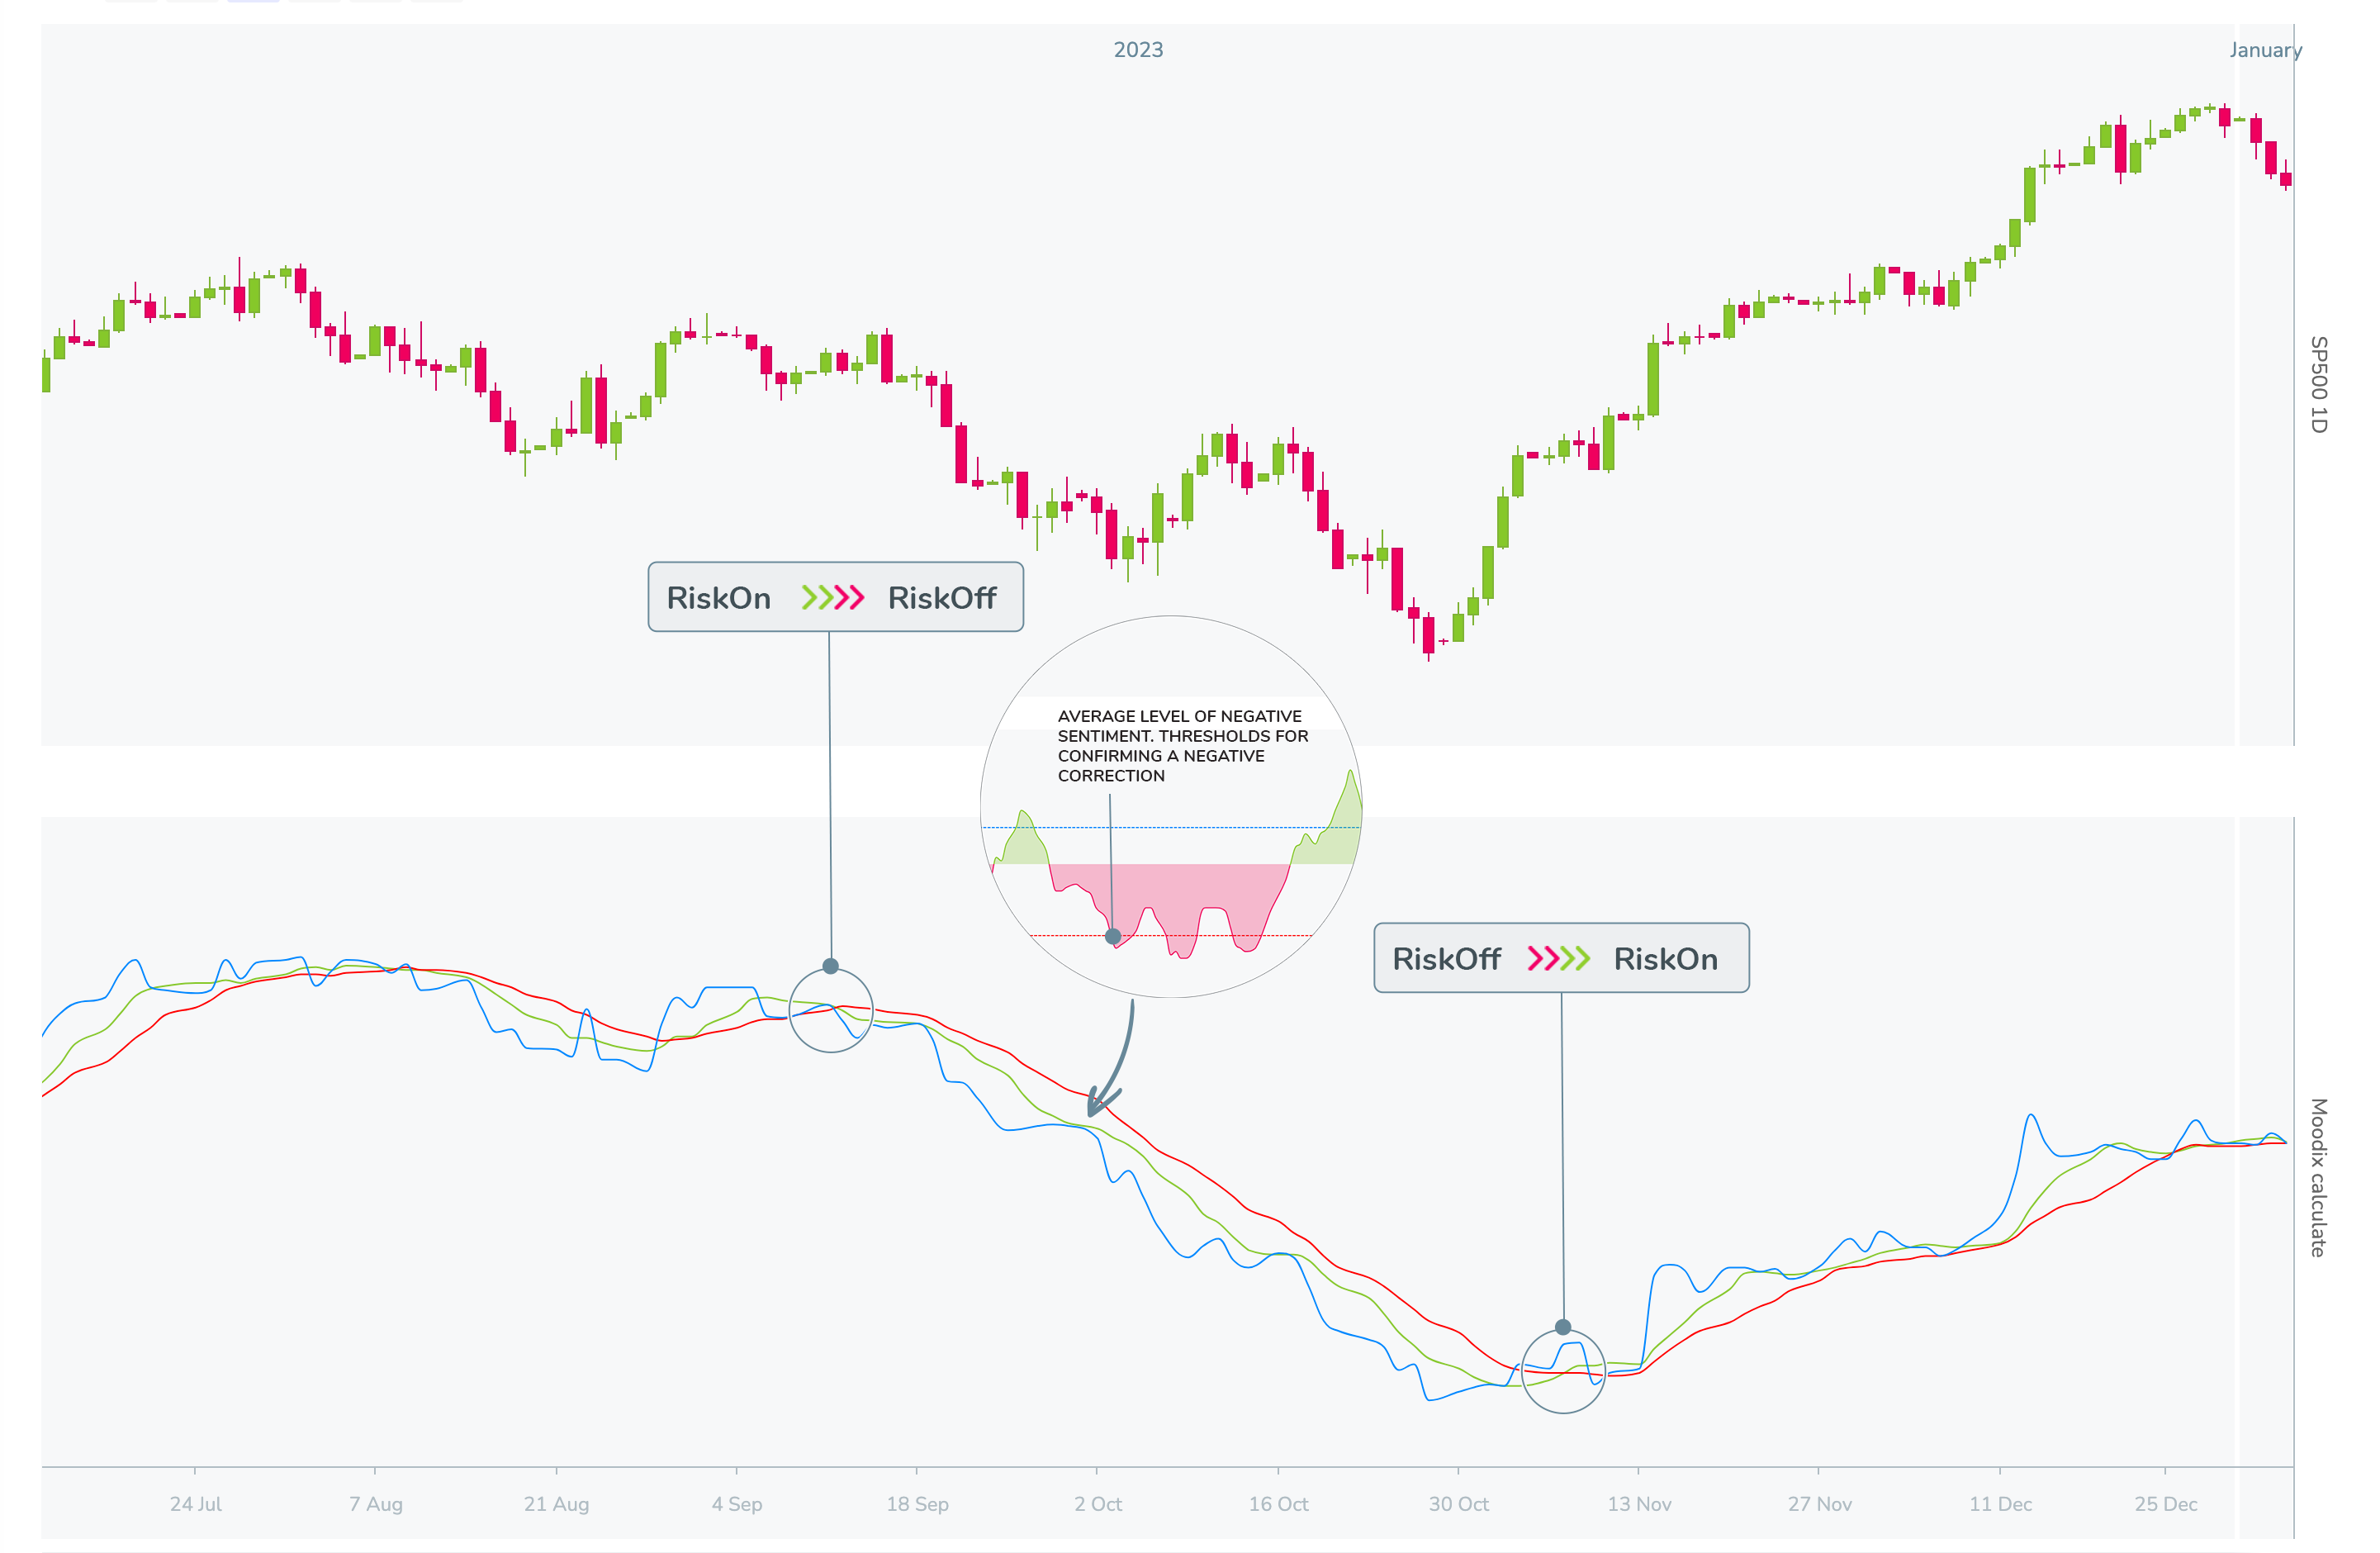
As you can read here in How it works, sentiment waves are constructed using moving averages of market sentiment for 5 (green) and 10 (red) days. The oscillation of the Moodix index (blue) indicates how the current market sentiment differs from the past (market memory). An example of the sentiment correction process can be seen here:
Notice the development of the moving averages. The current sentiment (blue) did not surpass the average sentiment for 5 days for some time already and the average for 5 days did not surpass the average for 10 days. Such a development is usually observed in strong negative trends and is usually the result of broader problems that the market perceives as a serious burden.
4. End of correction and start of positive sentiment
The end of a correction (or more precisely the termination of a correction) occurs when the current sentiment value closes between the averages for 5 and 10 days (or at the same values) after a confirmed correction (see above). It’s very important for the Moodix index value to close among these averages. Markets are volatile and very often the value of the Moodix index steps between the averages within a day. This often happens during the European session.
At this point, the first signals for allocating capital to long positions emerge and this signal changes the environment from negative to positive. This applies to medium-term and short-term time frames as well.
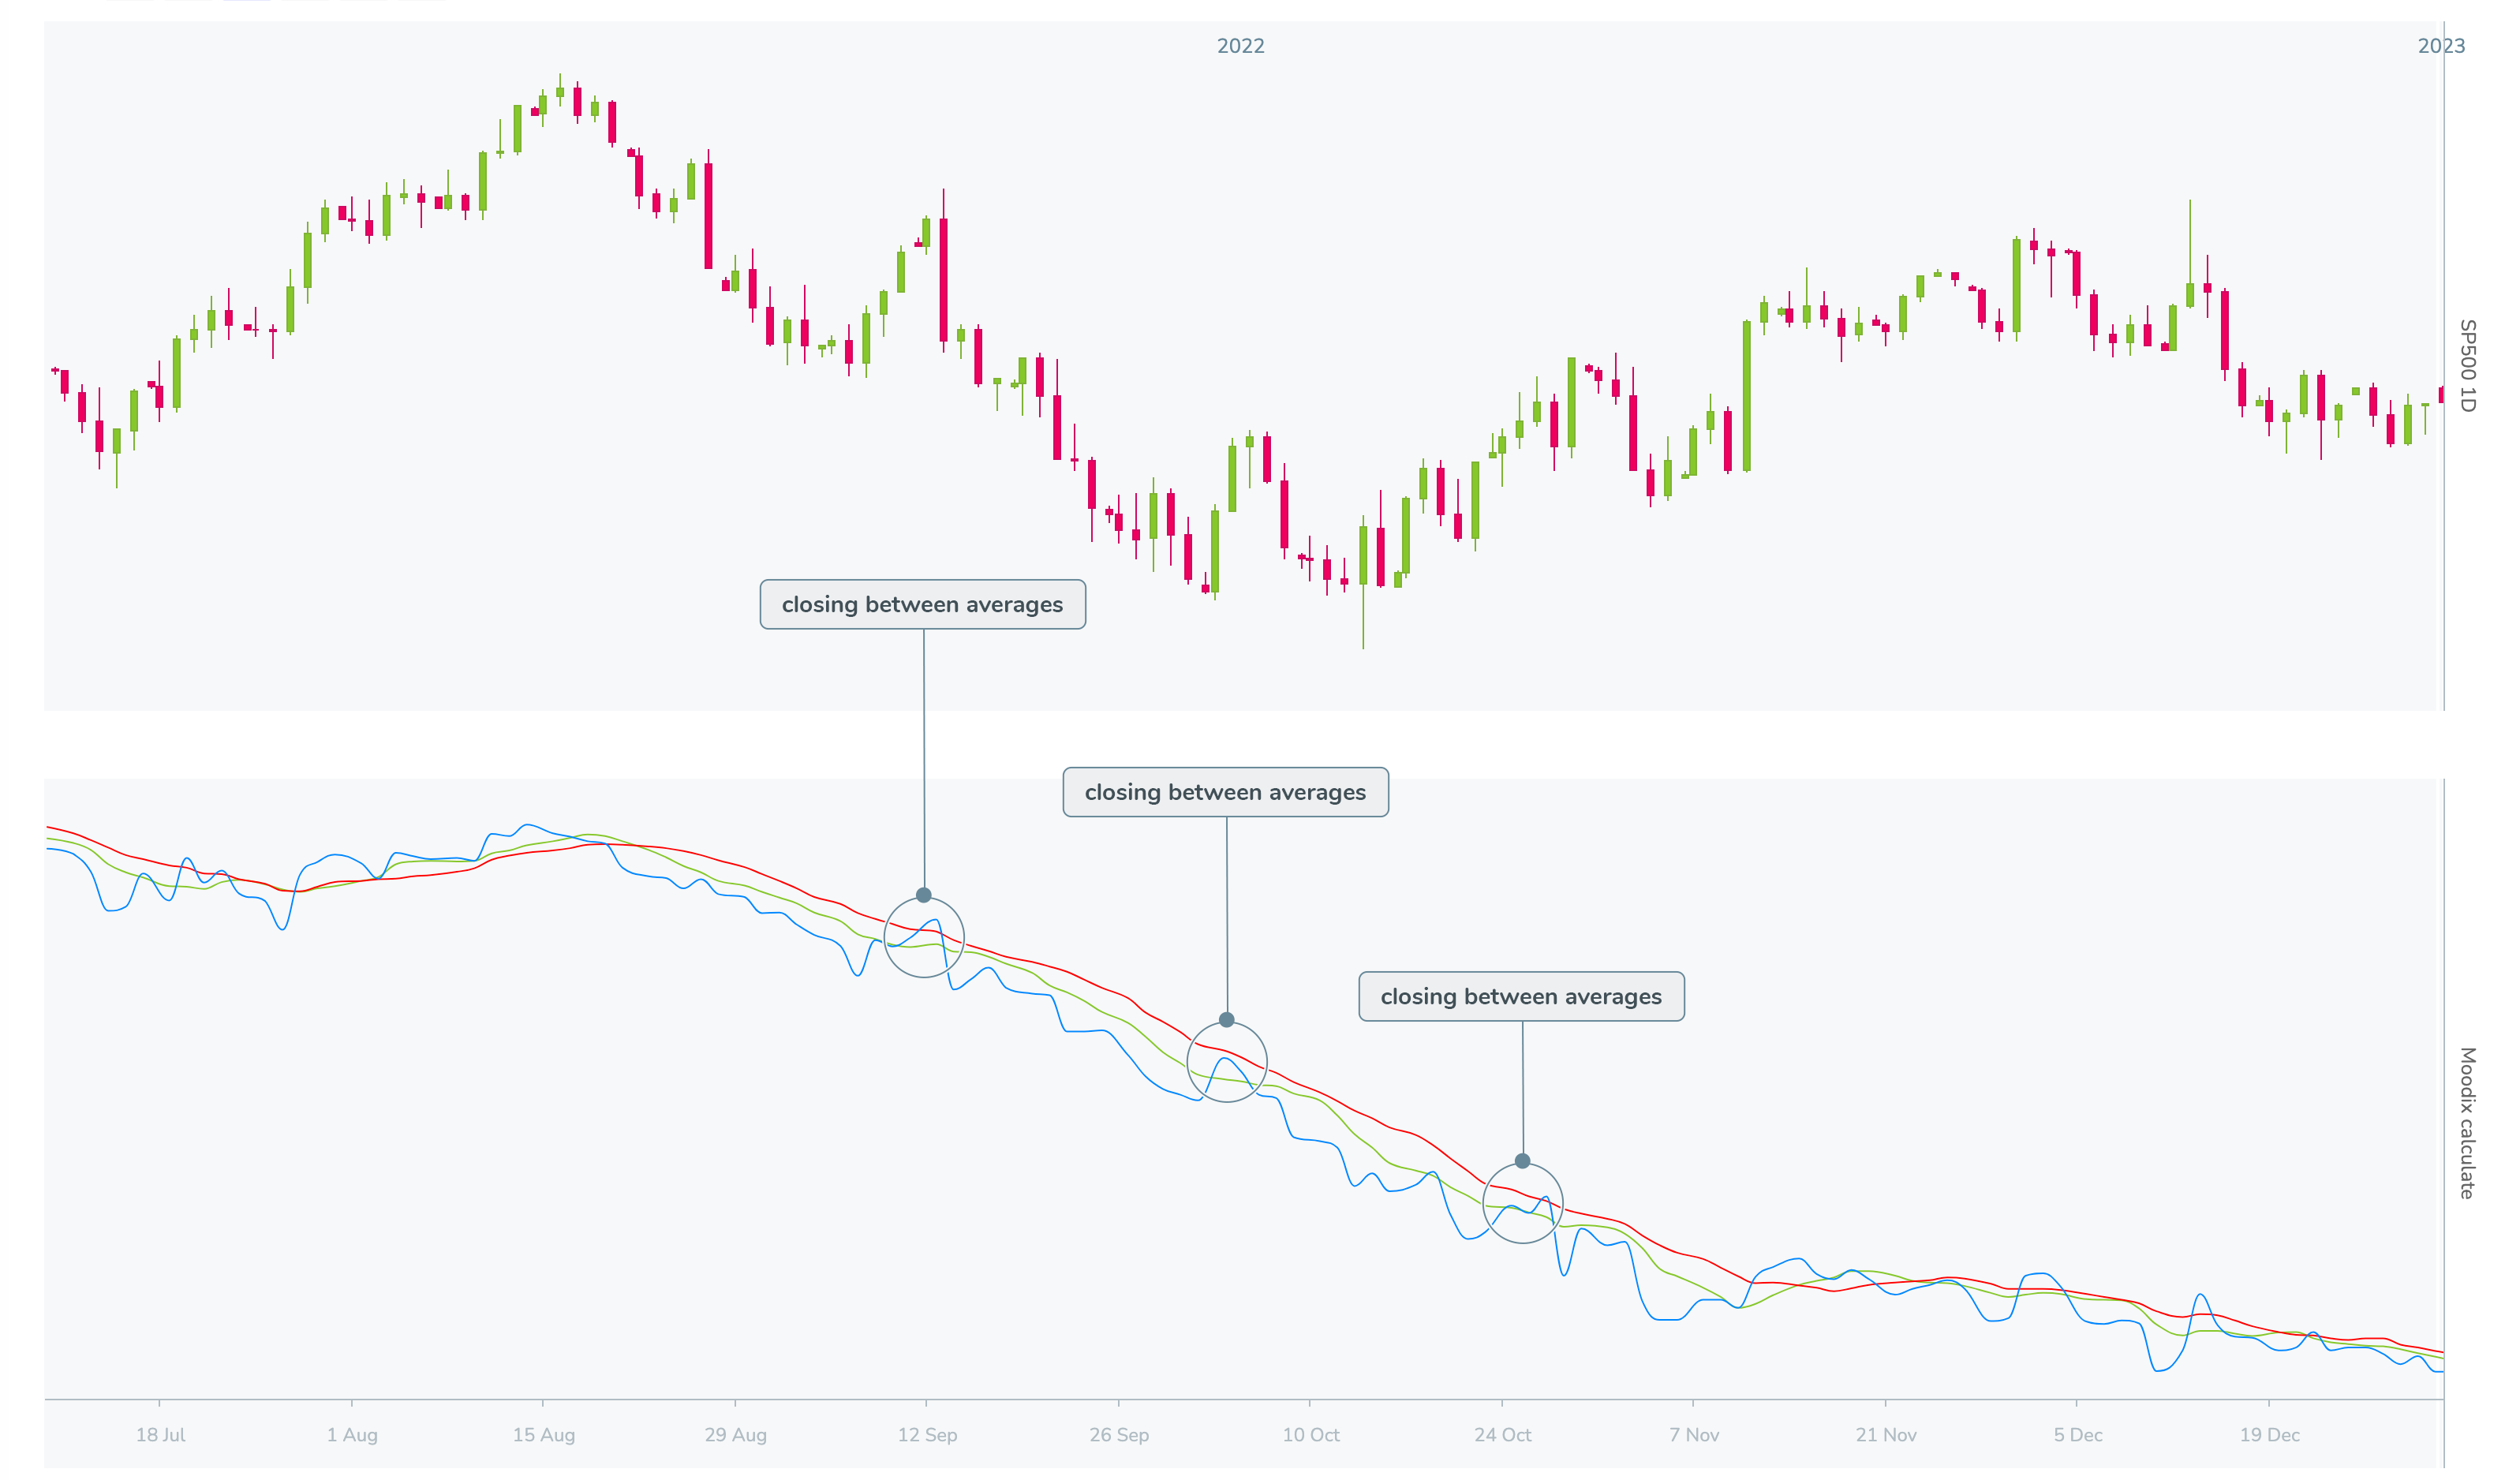
The signal can be false sometimes, e.g., when the market disproportionately reacts to incoming news which is then retracted, etc. This can be observed in situations from 2022:
The first signal was false but the second was true for the market and since then, the market has been rising (even though the sentiment still showed signs of instability). Therefore, we always work with probability and adjust our Money and Trade management accordingly.
5. Start of positive sentiment and its strength
If the signal about the end of negative RiskOff sentiment is true, the market completely switches to positive RiskOn sentiment within a few days (you can read why this is the case in How it Works). The reasons (problems) for previous declines are either resolved, absorbed or overtaken by another positive topic. The deeper and longer the correction was, the bigger and longer the subsequent rise.
Positive sentiment is again defined by the averages for 5 and 10 days as well as the Moodix index. The current Moodix index is above the average sentiment for 5 days and the average for 5 days is above the mood average for 10 days.
In terms of capital allocation on long-term time frames, we just monitor (capital is allocated from the end of RiskOff or the start of RiskOn). This positive environment is ideal for allocating capital in medium-term and short-term time frames.
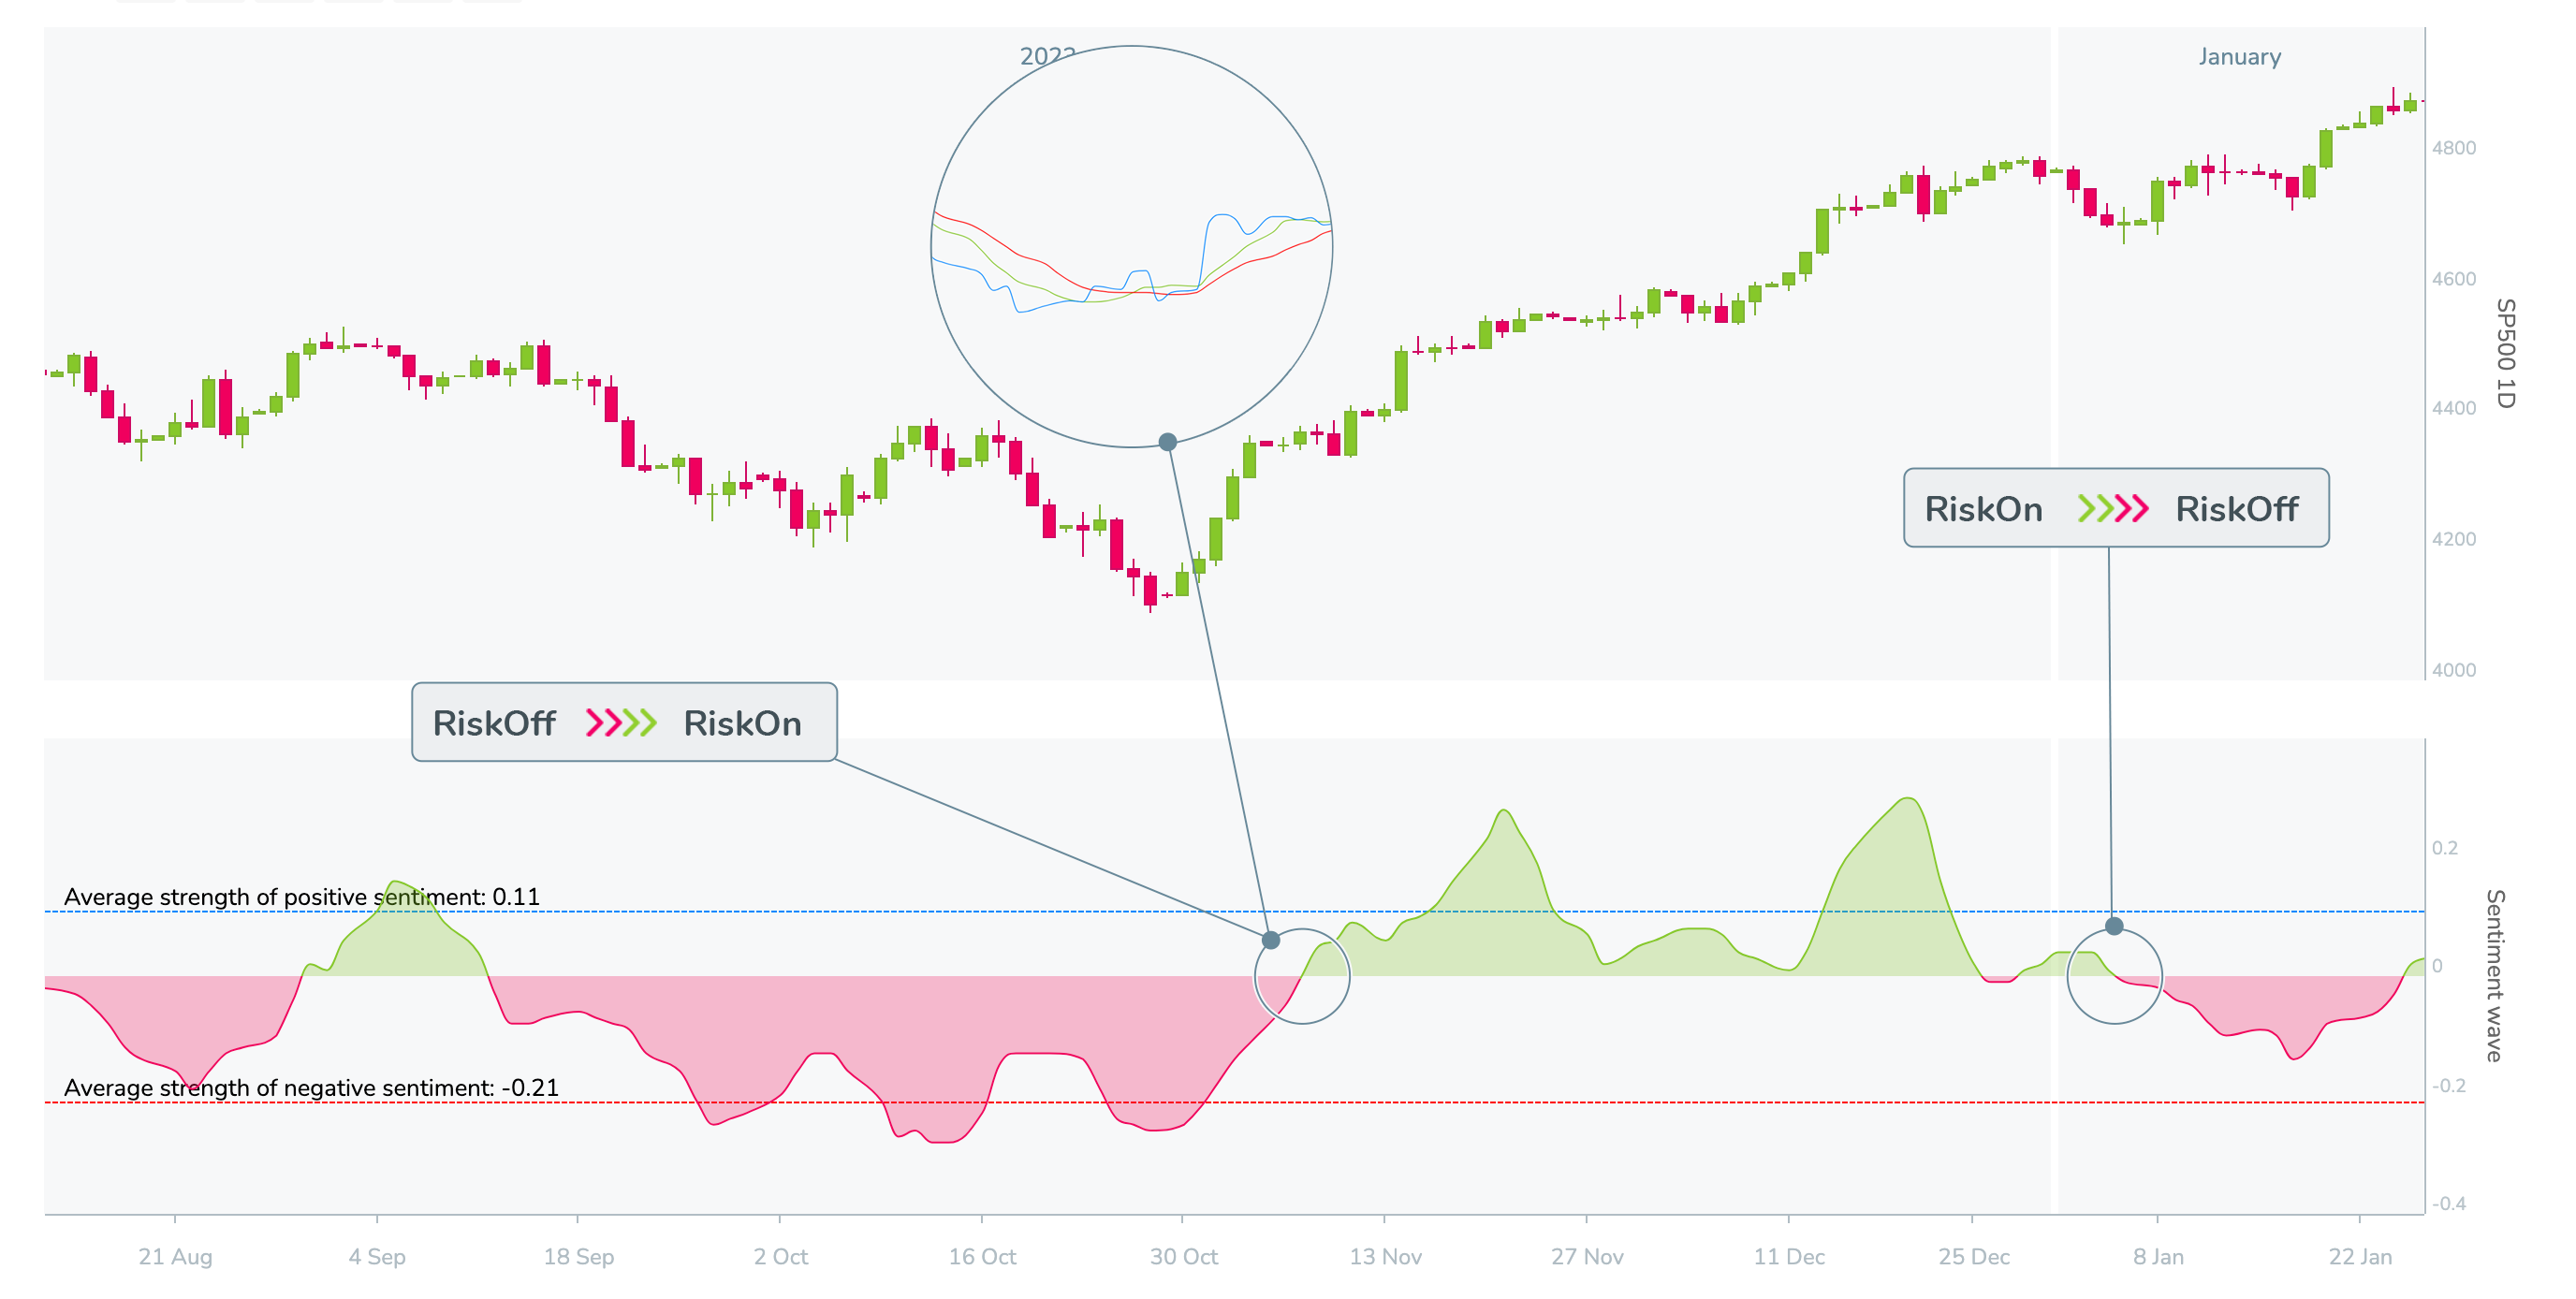
As with negative waves depth, we define the average height of positive waves. As you can see in the picture, for positive sentiment, it is 0.11p with a tolerance of 0.02p. You might wonder why this value is almost 50% lower than for negative sentiment. This is very simple and we write about it in How It Works. Negative sentiment (or fear) is always stronger in the markets than positive sentiment. It is about 1x more and these values are calculated from long-term measurement. Therefore, we do not require confirmation of growth as we do with a correction. Growth is a natural trend in financial markets.
However, the long-time average of positive sentiment helps us define how strong the trend is. This helps with capital allocation mainly on medium-term and long-term time frames. If a positive sentiment reaches the average, it indicates a strong trend and a high probability that the growth will last longer.
6. Ending or fading of positive sentiment
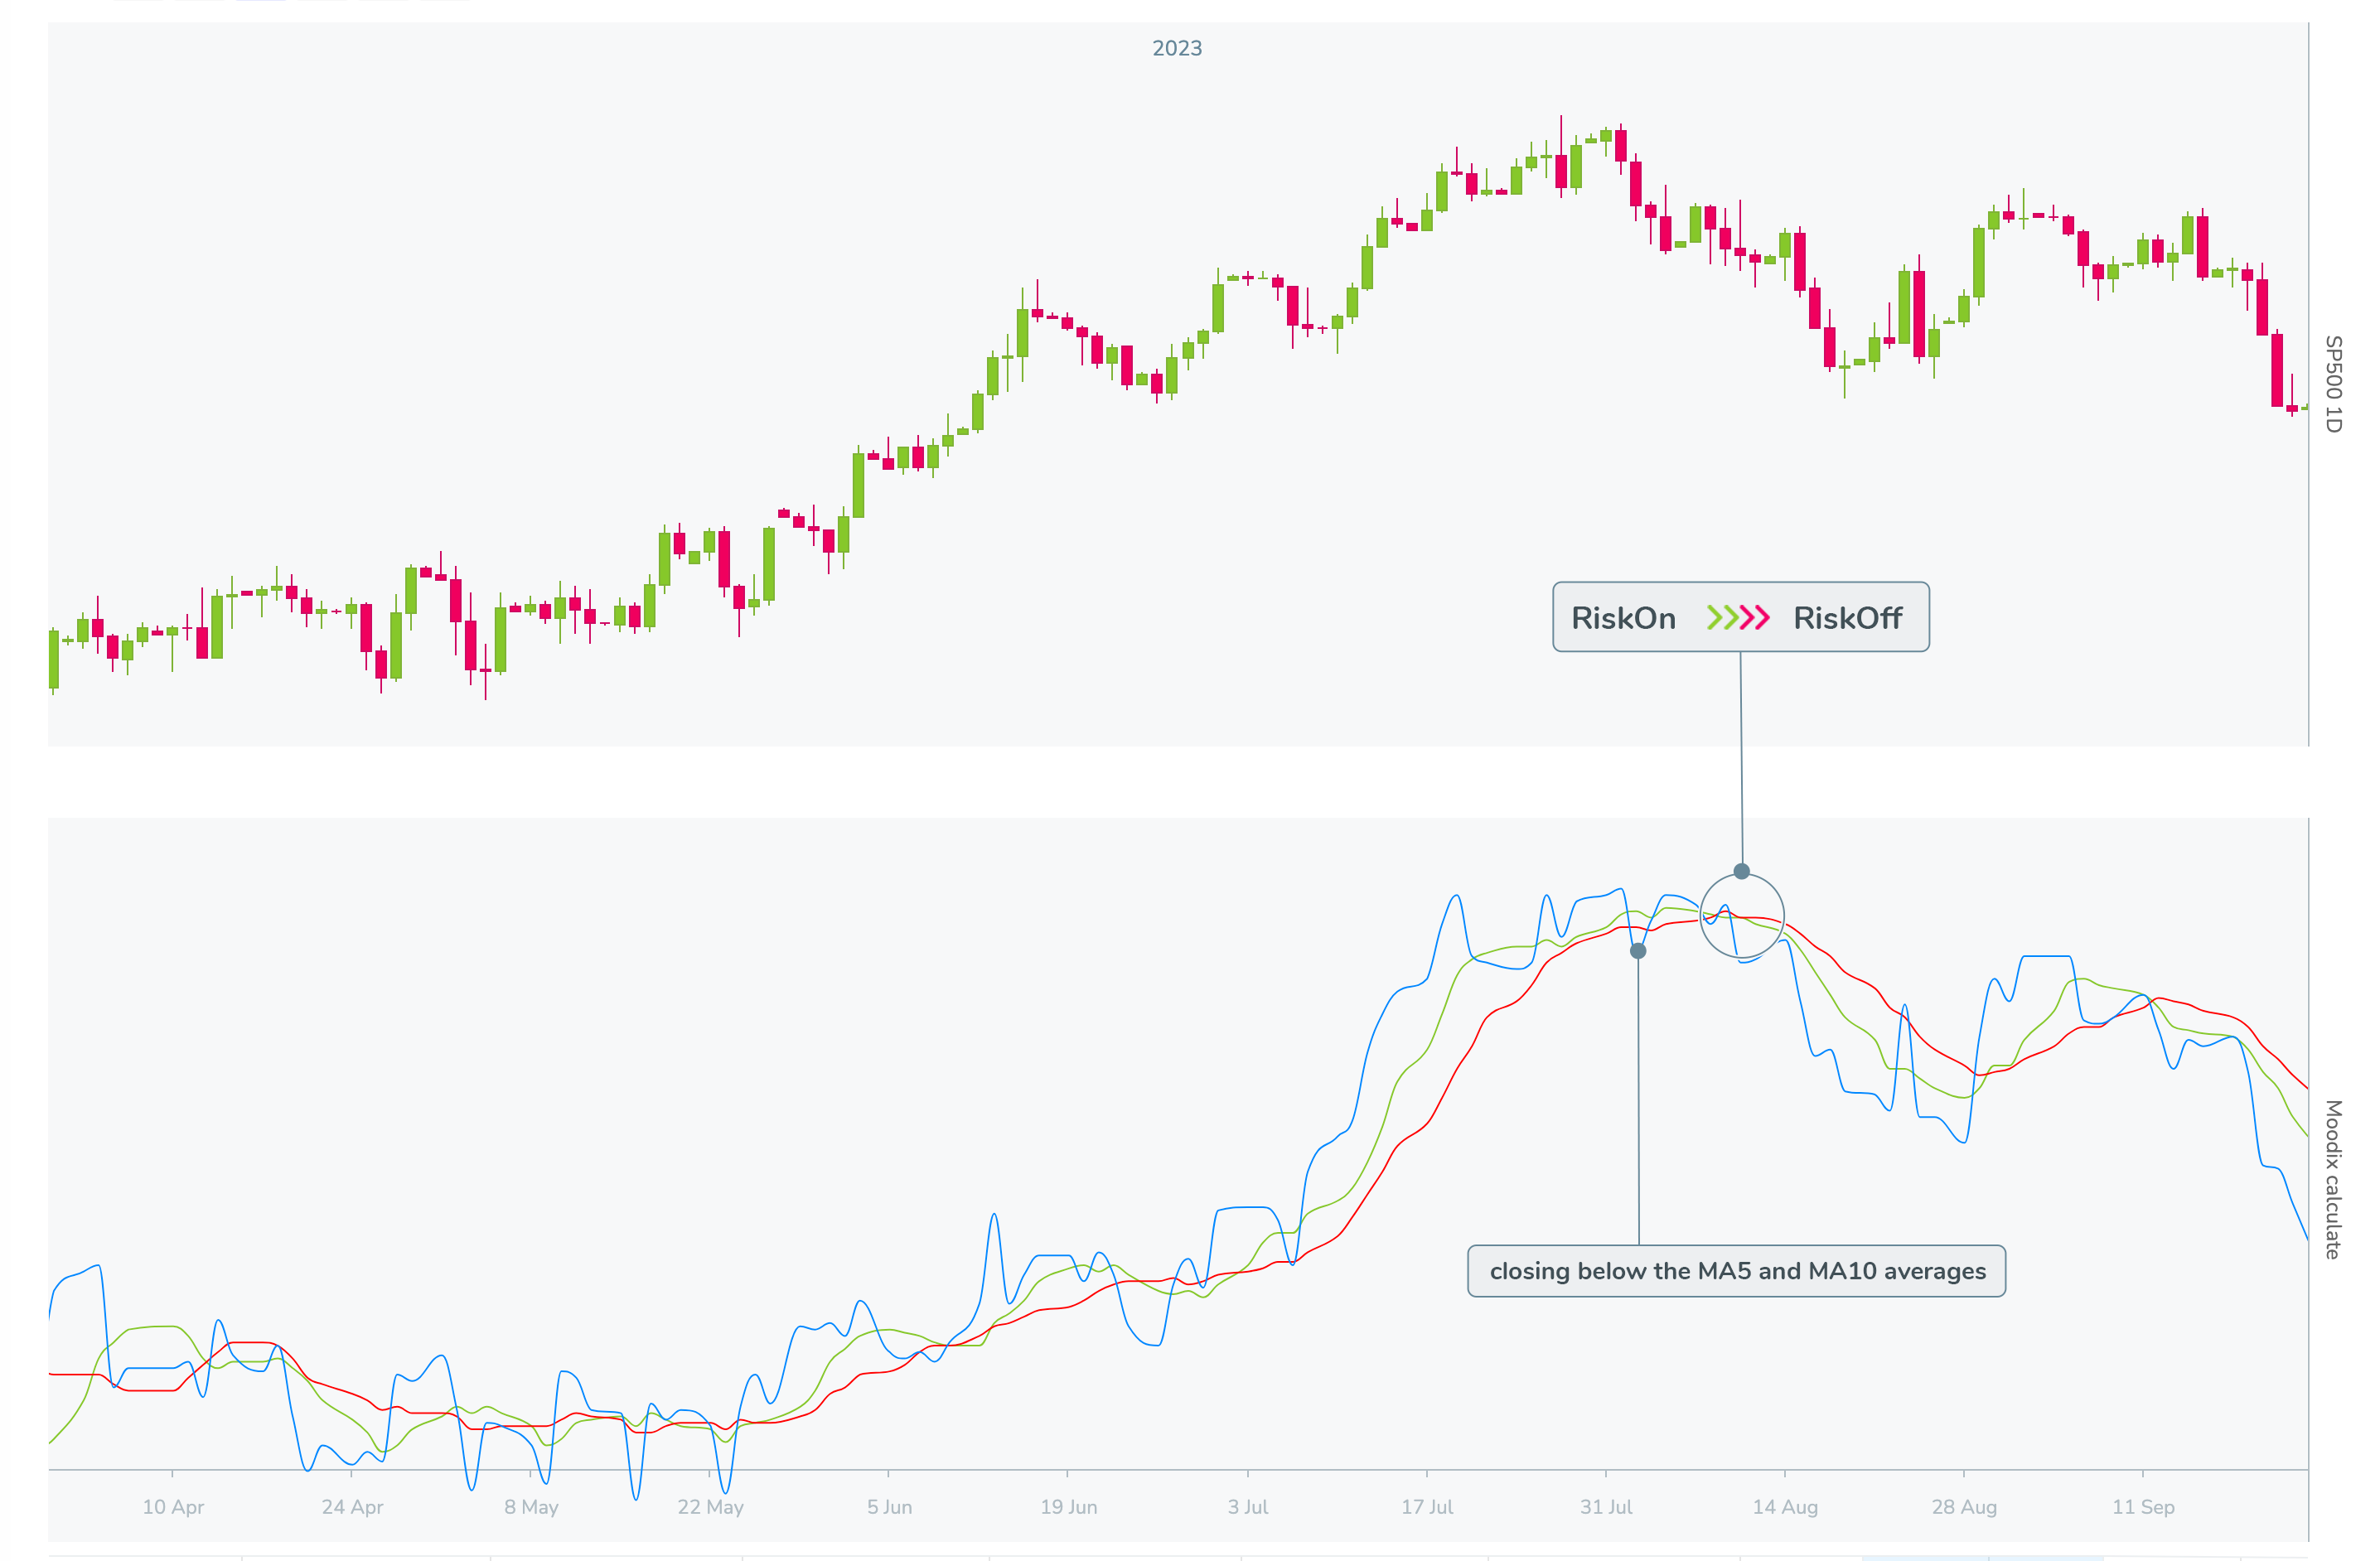
The first indication that positive sentiment is exhausted and losing strength occurs when the current sentiment of the Moodix index falls below both the 5-day and 10-day sentiment averages. This always signifies that some new negative force has come to the market and the upward movement is broken.
At that moment, it’s good to ask oneself, “What exactly is happening in the market and how should I react?” and answer it honestly. This situation indicates a higher chance of smaller or even a more substantial correction. We can completely ignore this signal, reduce market allocation or make a small hedge of the trading account (options, VIX, etc.).
Then we just wait to see whether the sentiment will continue to deteriorate (confirming the correction) or if the market absorbs the negativity and returns to positive values.
Indecipherable sentiment
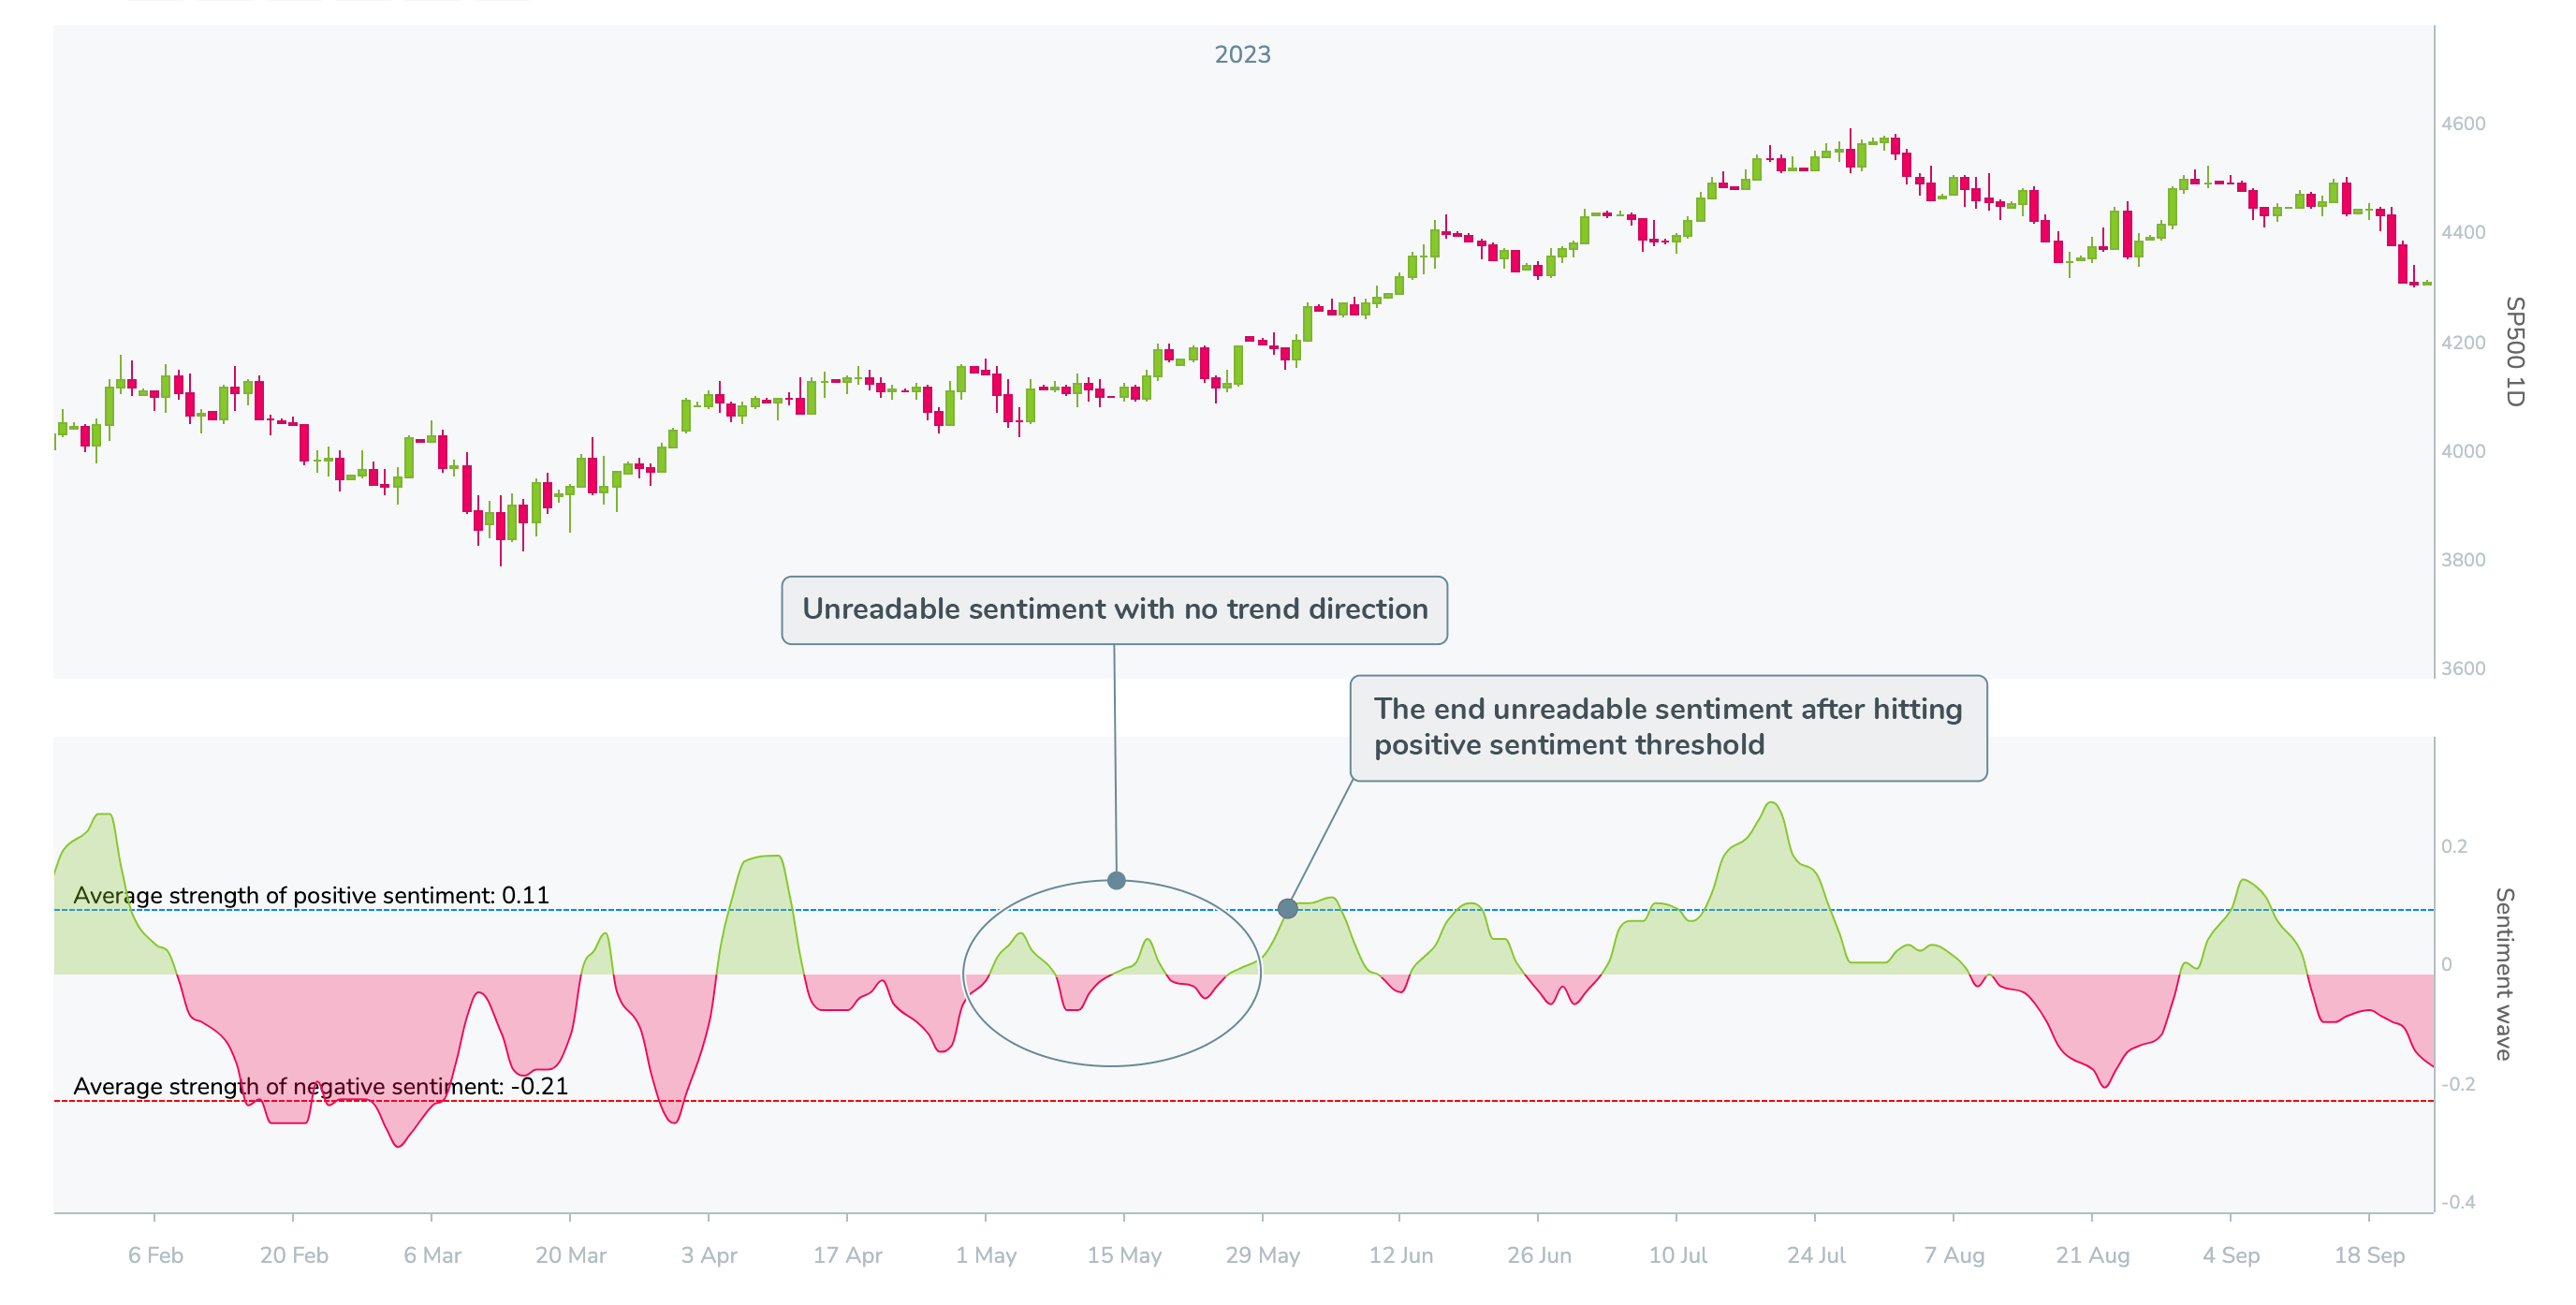
At certain times the sentiment is unreadable or lacks direction. We define these situations with a simple rule. These are 2 consecutive waves of short duration (averagely 5 days) and weak strength. These moments look as follows:
During such times we wait for the sentiment to clarify its direction. This occurs if the subsequent RiskOn or RiskOff wave reaches the wave’s long-term average strength (Average strength of positive sentiment and Average strength of negative sentiment).
