Medium-term time frames
Interpretation of measured market sentiment in hourly time frames
Capital allocation in medium-term time frames usually lasts a number of days/weeks. Regardless of the strategy you use, you most likely try to take advantage of volatility and allocate capital according to the trend. Moodix helps to increase the probability of success for your entries by simply looking at the moodix sentiment a weekly sentiment.
What is weekly sentiment?
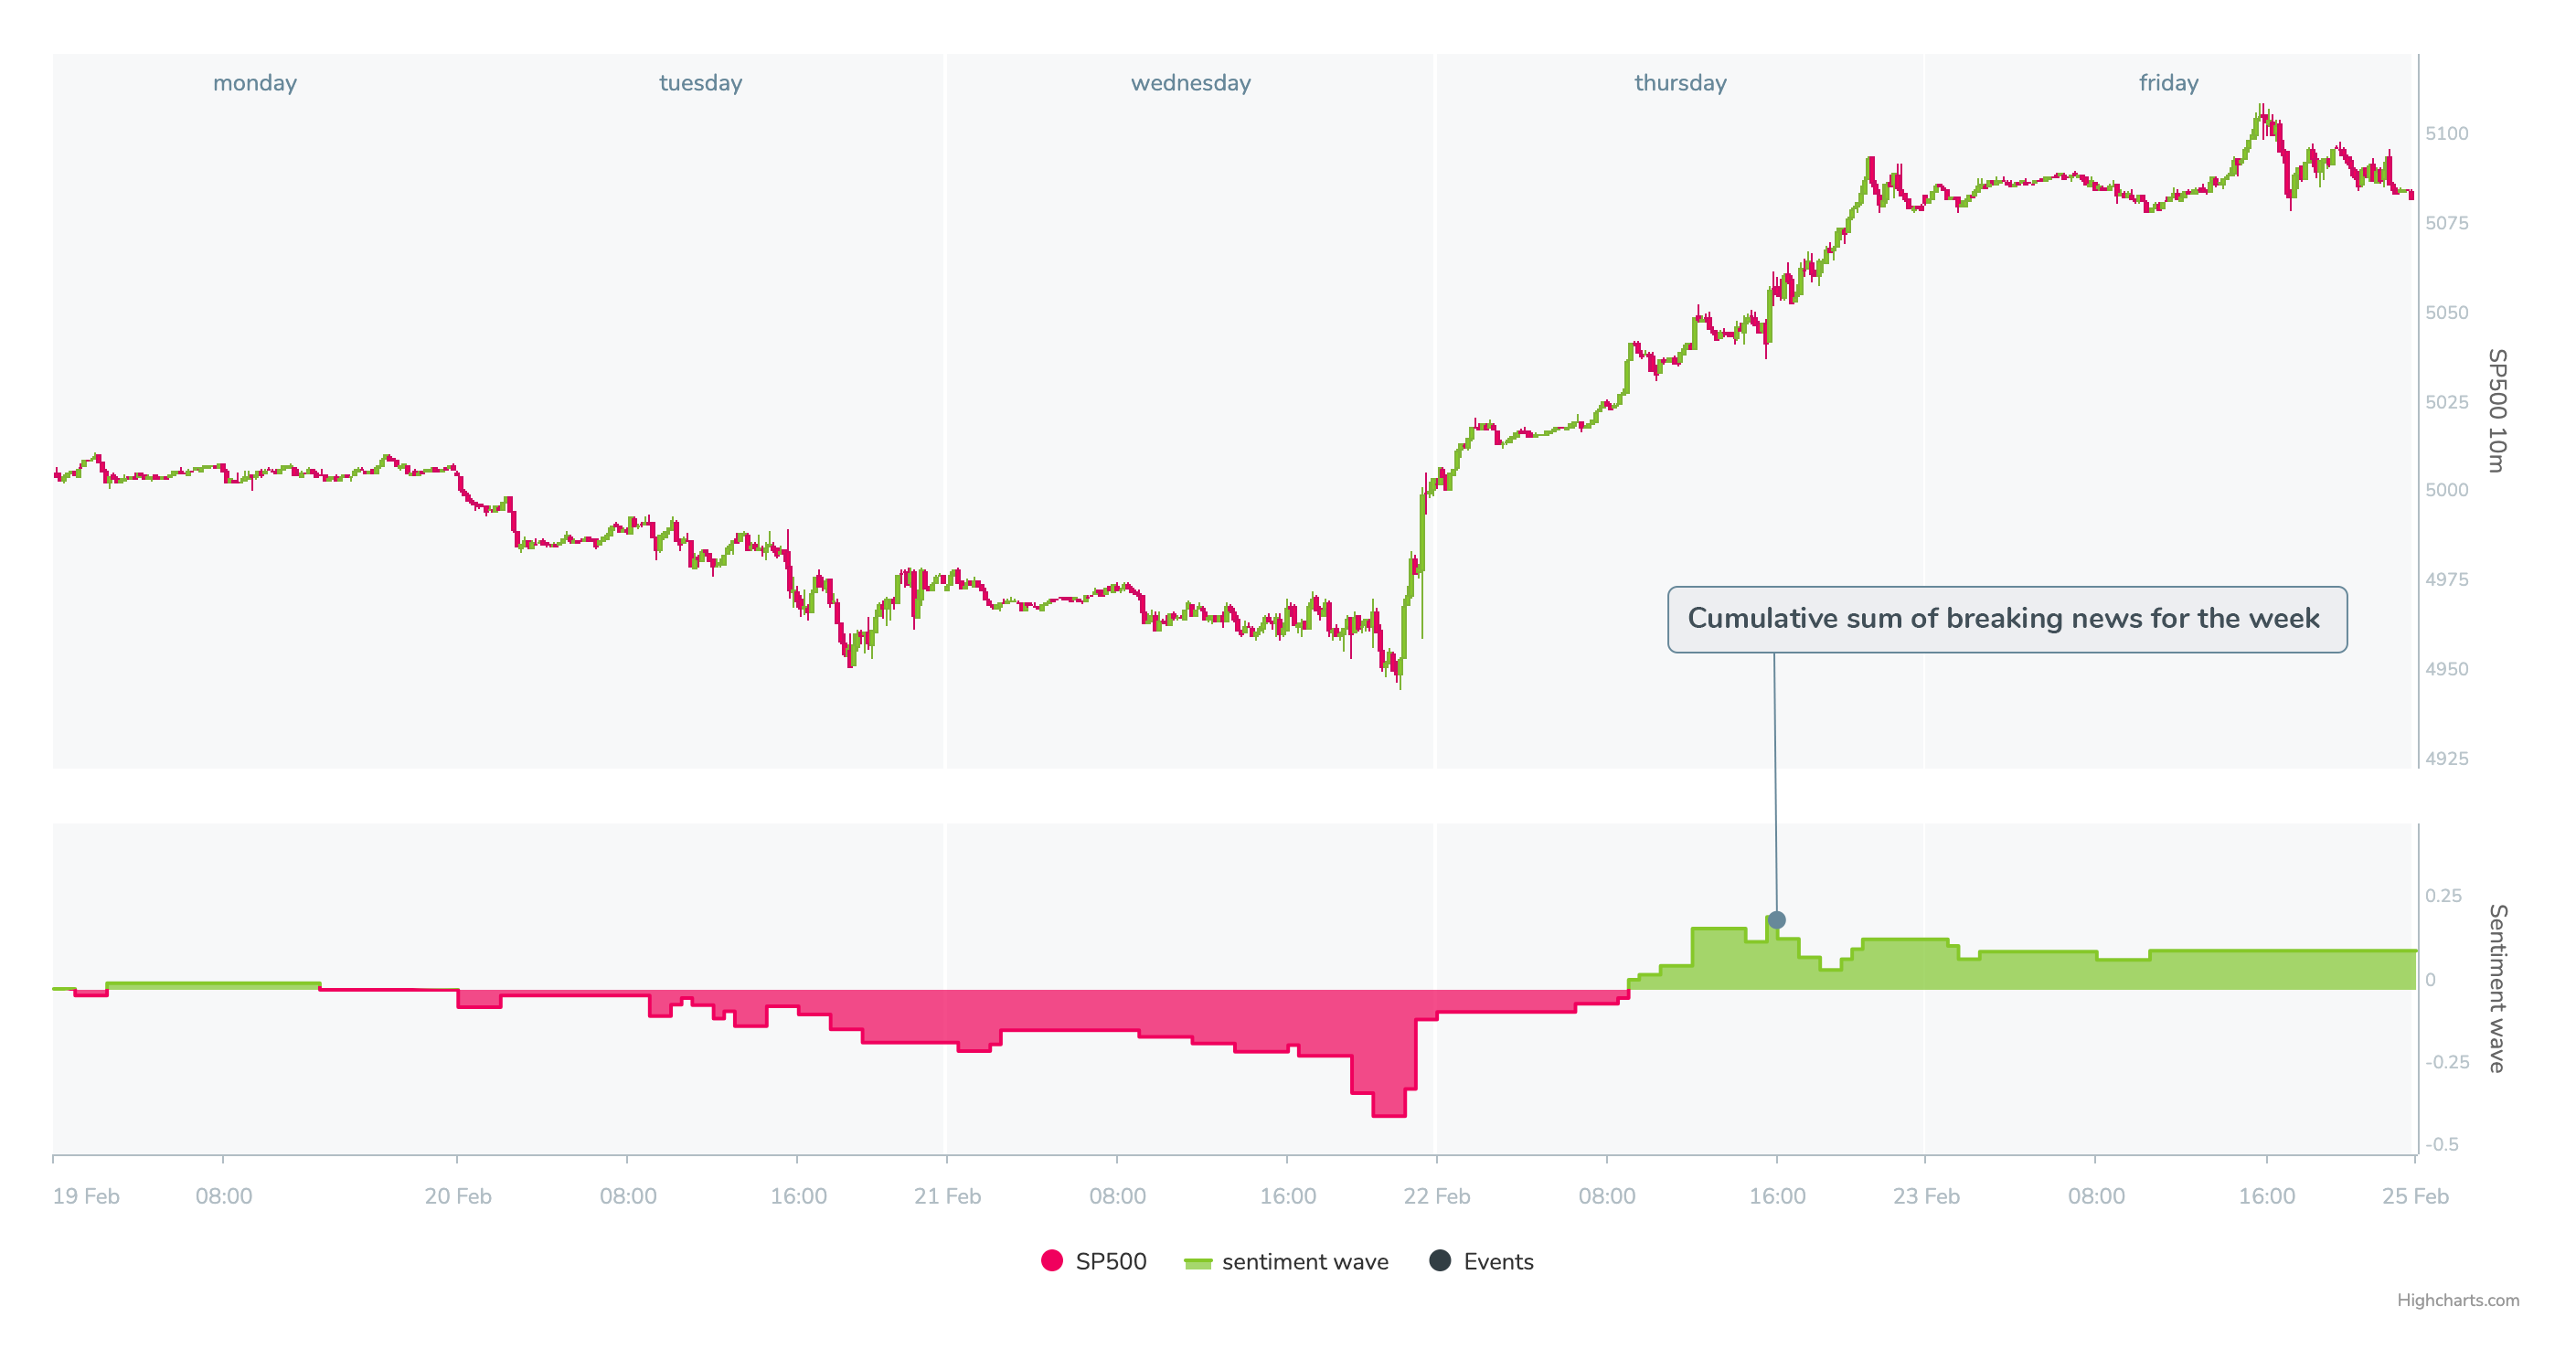
It’s the sum of all values of the current week’s breaking news. It looks like this in Moodix app:
In the chart, you can track the development of measurements of breaking news within the respective week. The chart shows its development throughout the week – the SP500 chart is shown above and the chart of the development of the measured sentiment for the respective week (the sum of all breaking news values) below it. All news measured within the week are automatically counted into the overall long-term sentiment and we can observe how it develops within the week (the value is set to zero at the beginning of each week).
How to read weekly sentiment?
In the image above, you can see a sample of a positive sentiment development throughout the week with it deteriorating at the end of the week. However, looking at this development it is more of a hindsight. For us, this chart will always be important at its beginning and how it develops during the week. Such development may look like this:
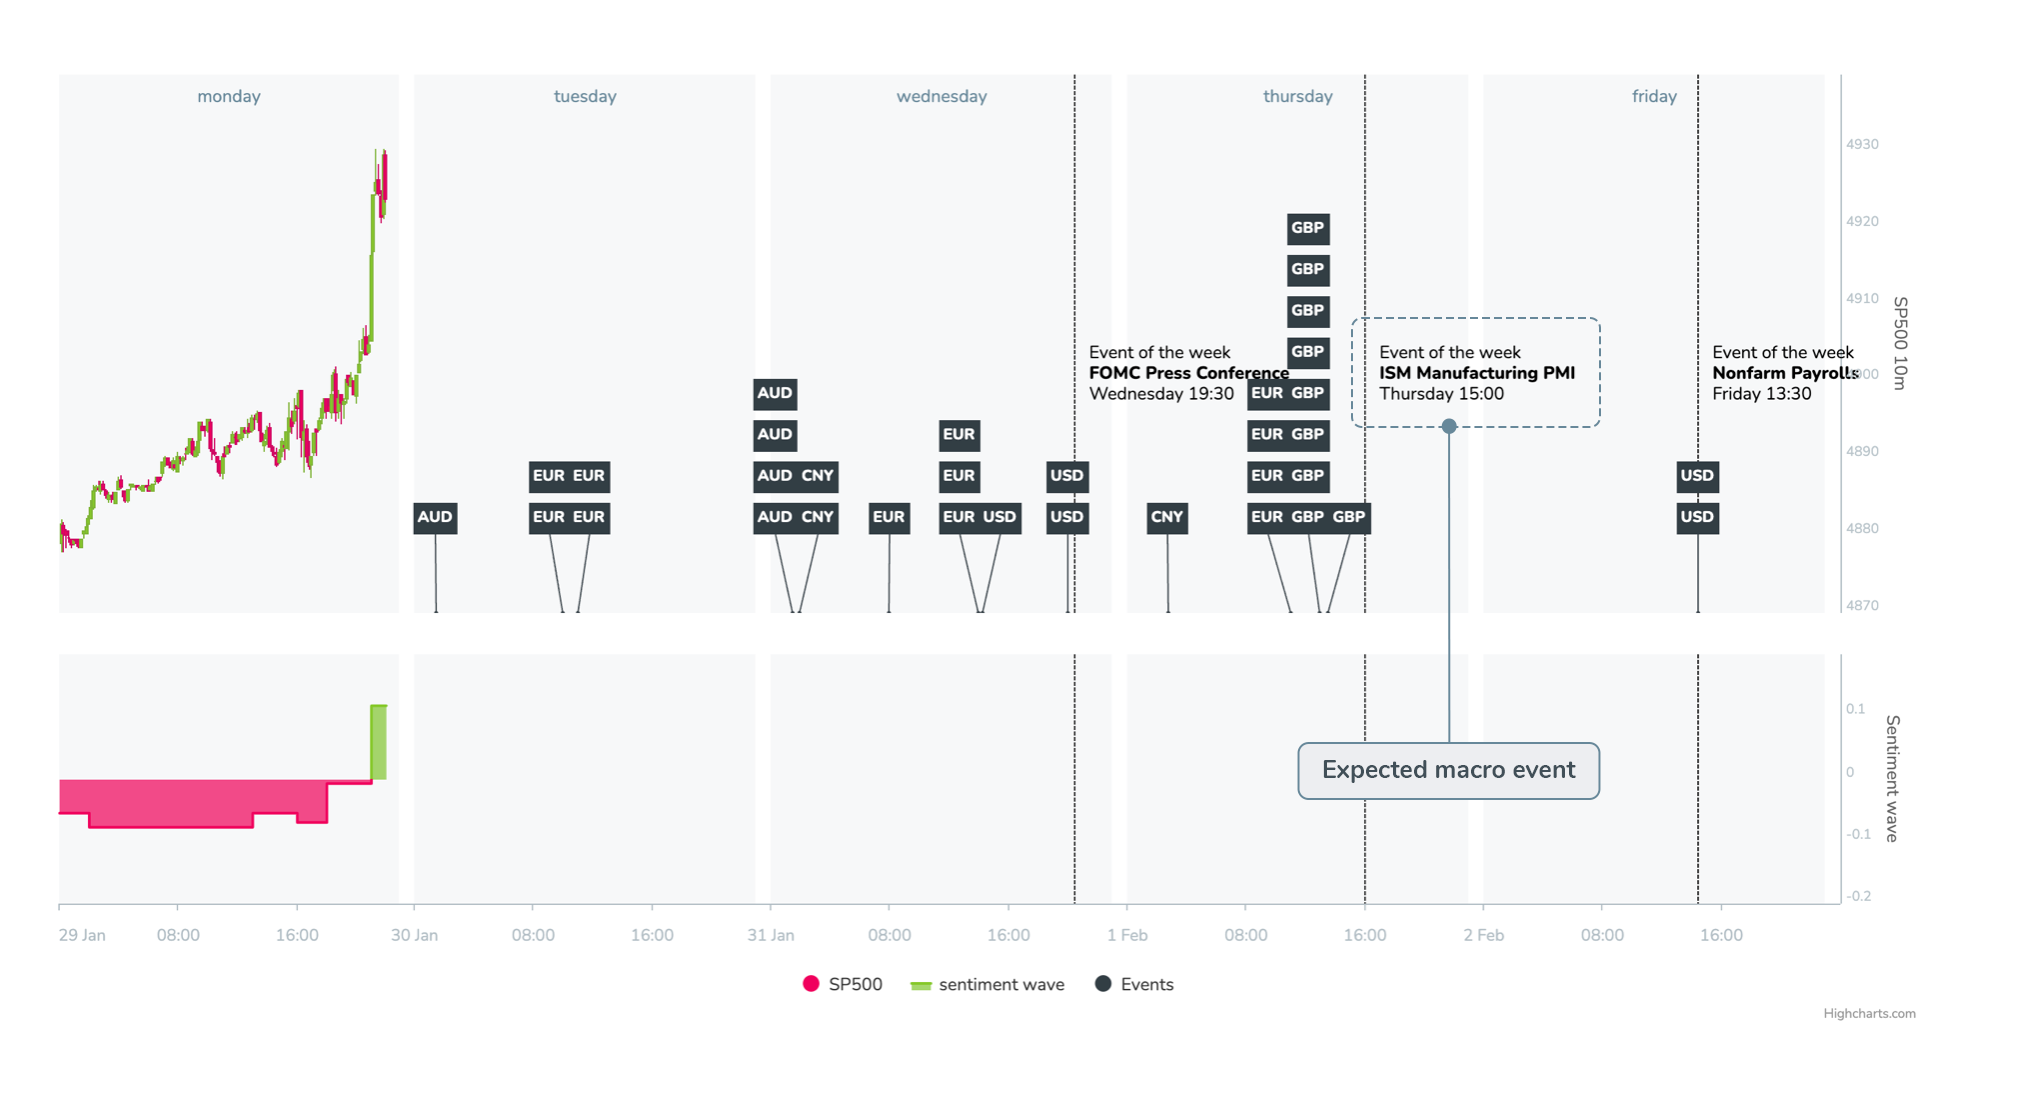
In this chart, you can see the development on the first business day – Monday and future main macroeconomic events that are likely to cause bigger or smaller market movements. Events that are important and are expected to have a big impact on the market are indicated by vertical lines in respective times of the week and their names displayed, for example, FOMC, ISM or NFP.
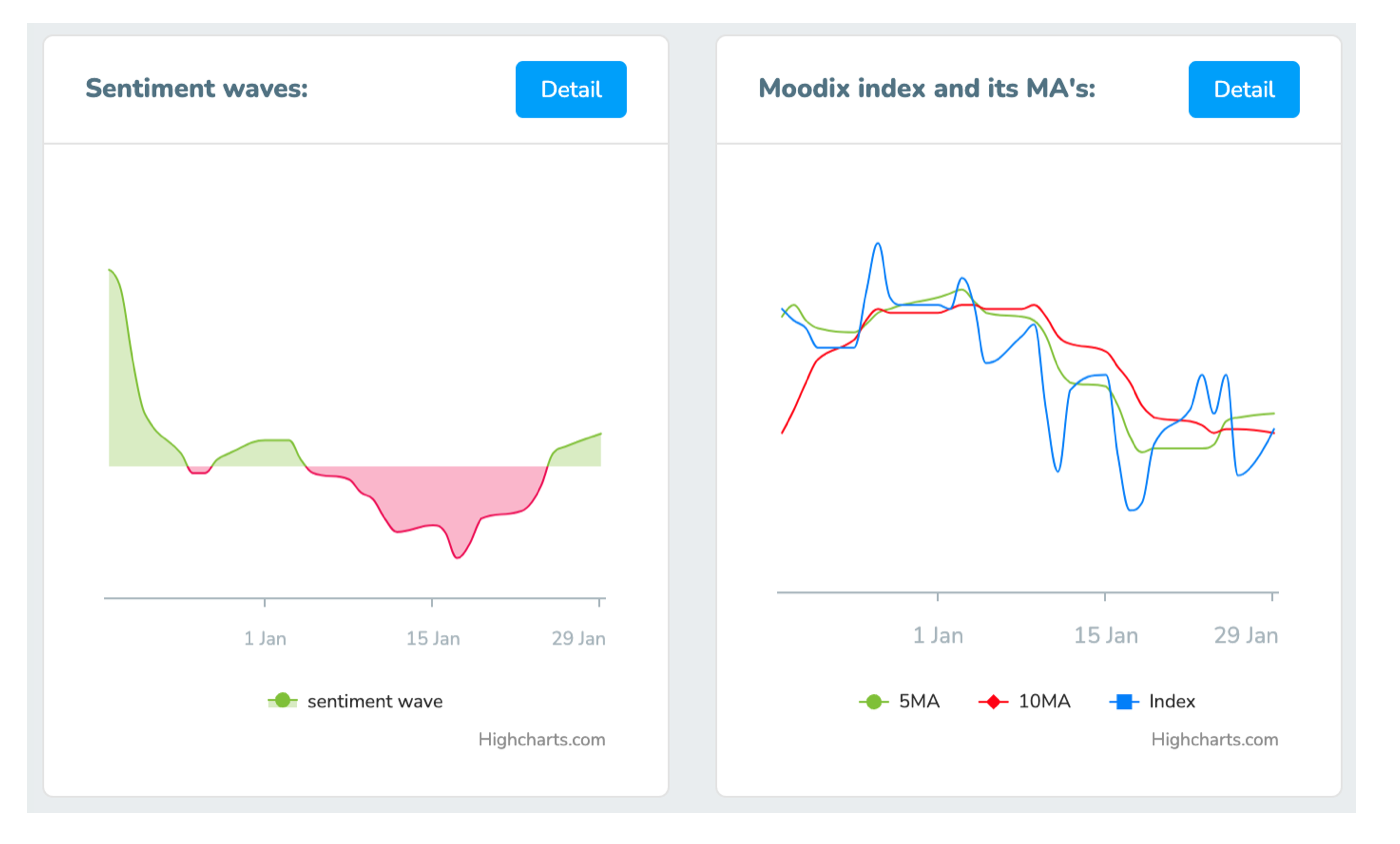
The image depicts that the week started negatively (during the Asian session) and temporarily improved (moved from negative/minus territory to positive). At the same time, we know that moodix sentiment indicates the beginning of a positive RiskOn and looks like the following:
For capital allocation in the medium-term time frame, we will look for long signals. Both from the very nature of positive sentiment and from the perspective that a positive RiskOn wave has just begun. We can never say with certainty how long such a wave will last, how strong it will be, or whether it will be here for another week or month. However, we do know that pretty accurately just how the market is tuned and what direction it is most likely to take. We will simply give your entry a higher probability.
Signal confirmation
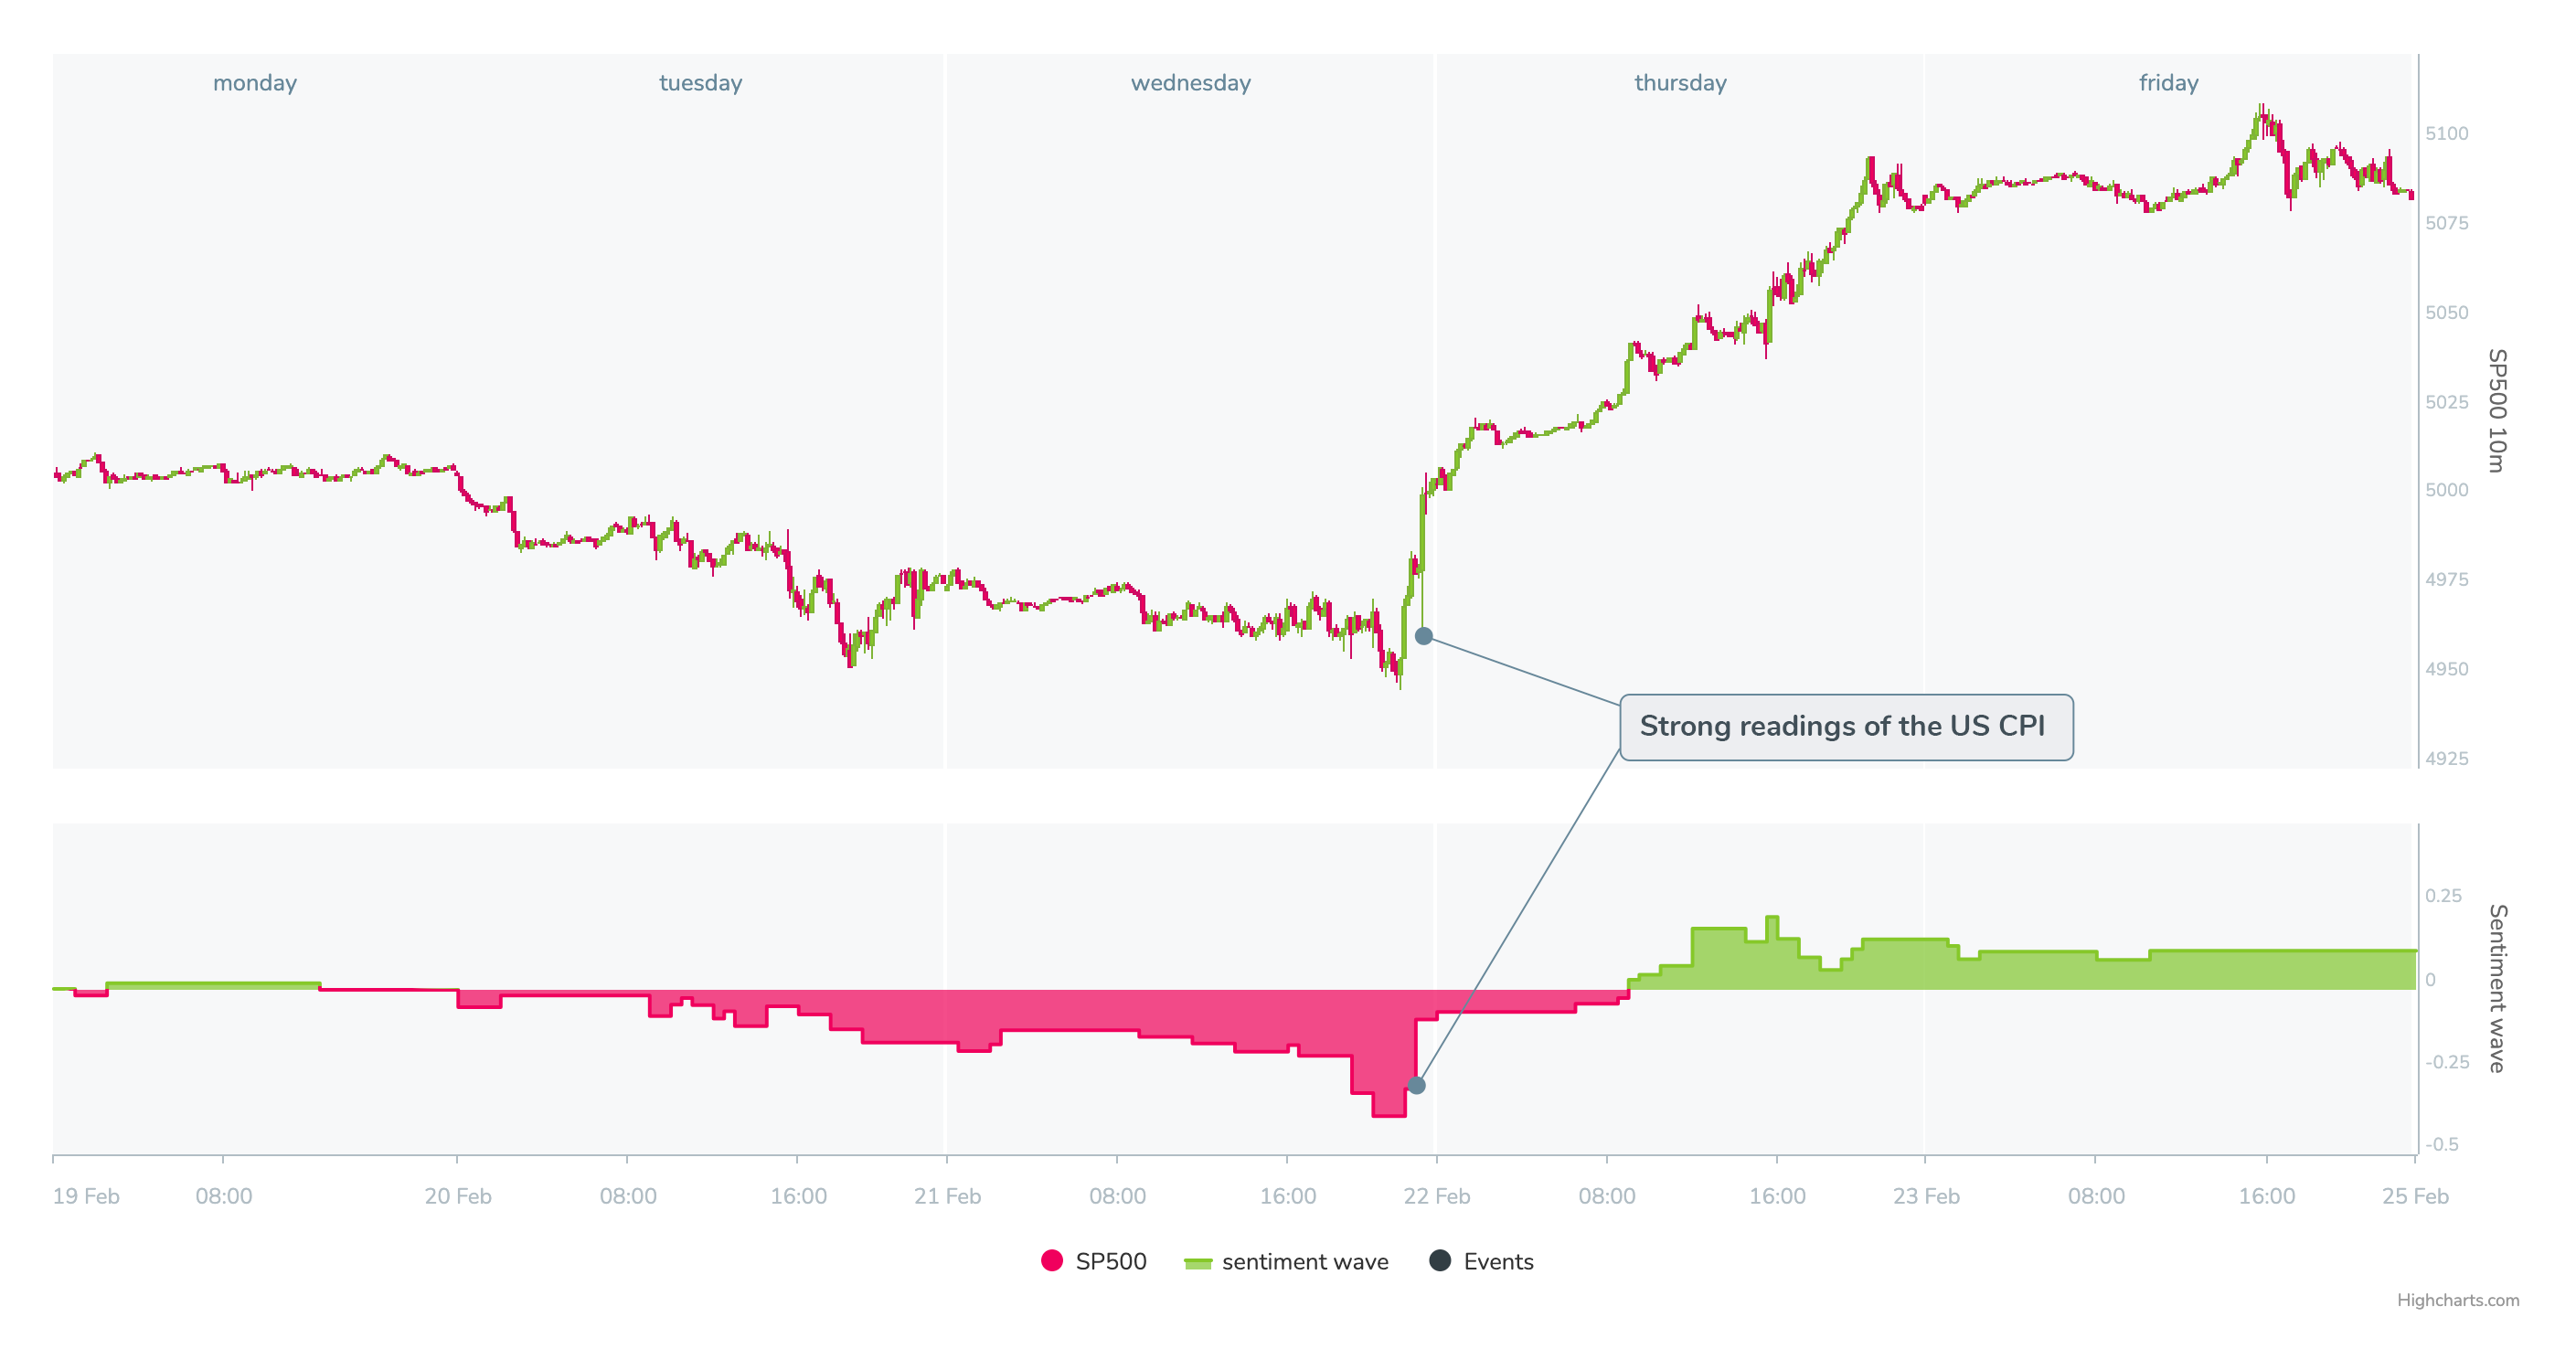
When allocating capital in medium-term time frames we often wait, for example, for a DIP (momentary counter-trend movement). This movement is usually caused by specific news (geopolitical, corporate etc.) or by a macroeconomic development.
The image above shows a nice buy opportunity created by the release of strong readings from the US CPI numbers. When we know that the moodix sentiment is RiskOn, the deterioration of the weekly sentiment to the lowest value within this week provided a great opportunity and exemplary confirmation for capital allocation.
Signal rejection
The opposite situation is also common. In the previous situation, it is enough to imagine that instead of a positive RiskOn sentiment, we are in a negative RiskOff sentiment. In this case, the same signal would not be confirming and would not be recommended in terms of the moodix measurement. Simply because of the negative environment, moodix would suggest there will be further moves lower.
In these situations, we wait for the sentiment to clarify itself – when the subsequent RiskOn or RiskOff wave reaches the average strength threshold (average strength of positive sentiment / average depth of negative sentiment).


