Short-term time frames
Interpretation of measured market sentiment on minute time frames.
Capital allocation on short-term time frames lasts in the order of hours. Regardless of the strategy, traders most likely try to take advantage of volatility and allocate capital according to the trend. Moodix can help increase the chances of success for your trades by simply looking at the moodix sentiment, weekly and intraday sentiment.
What is intraday sentiment?
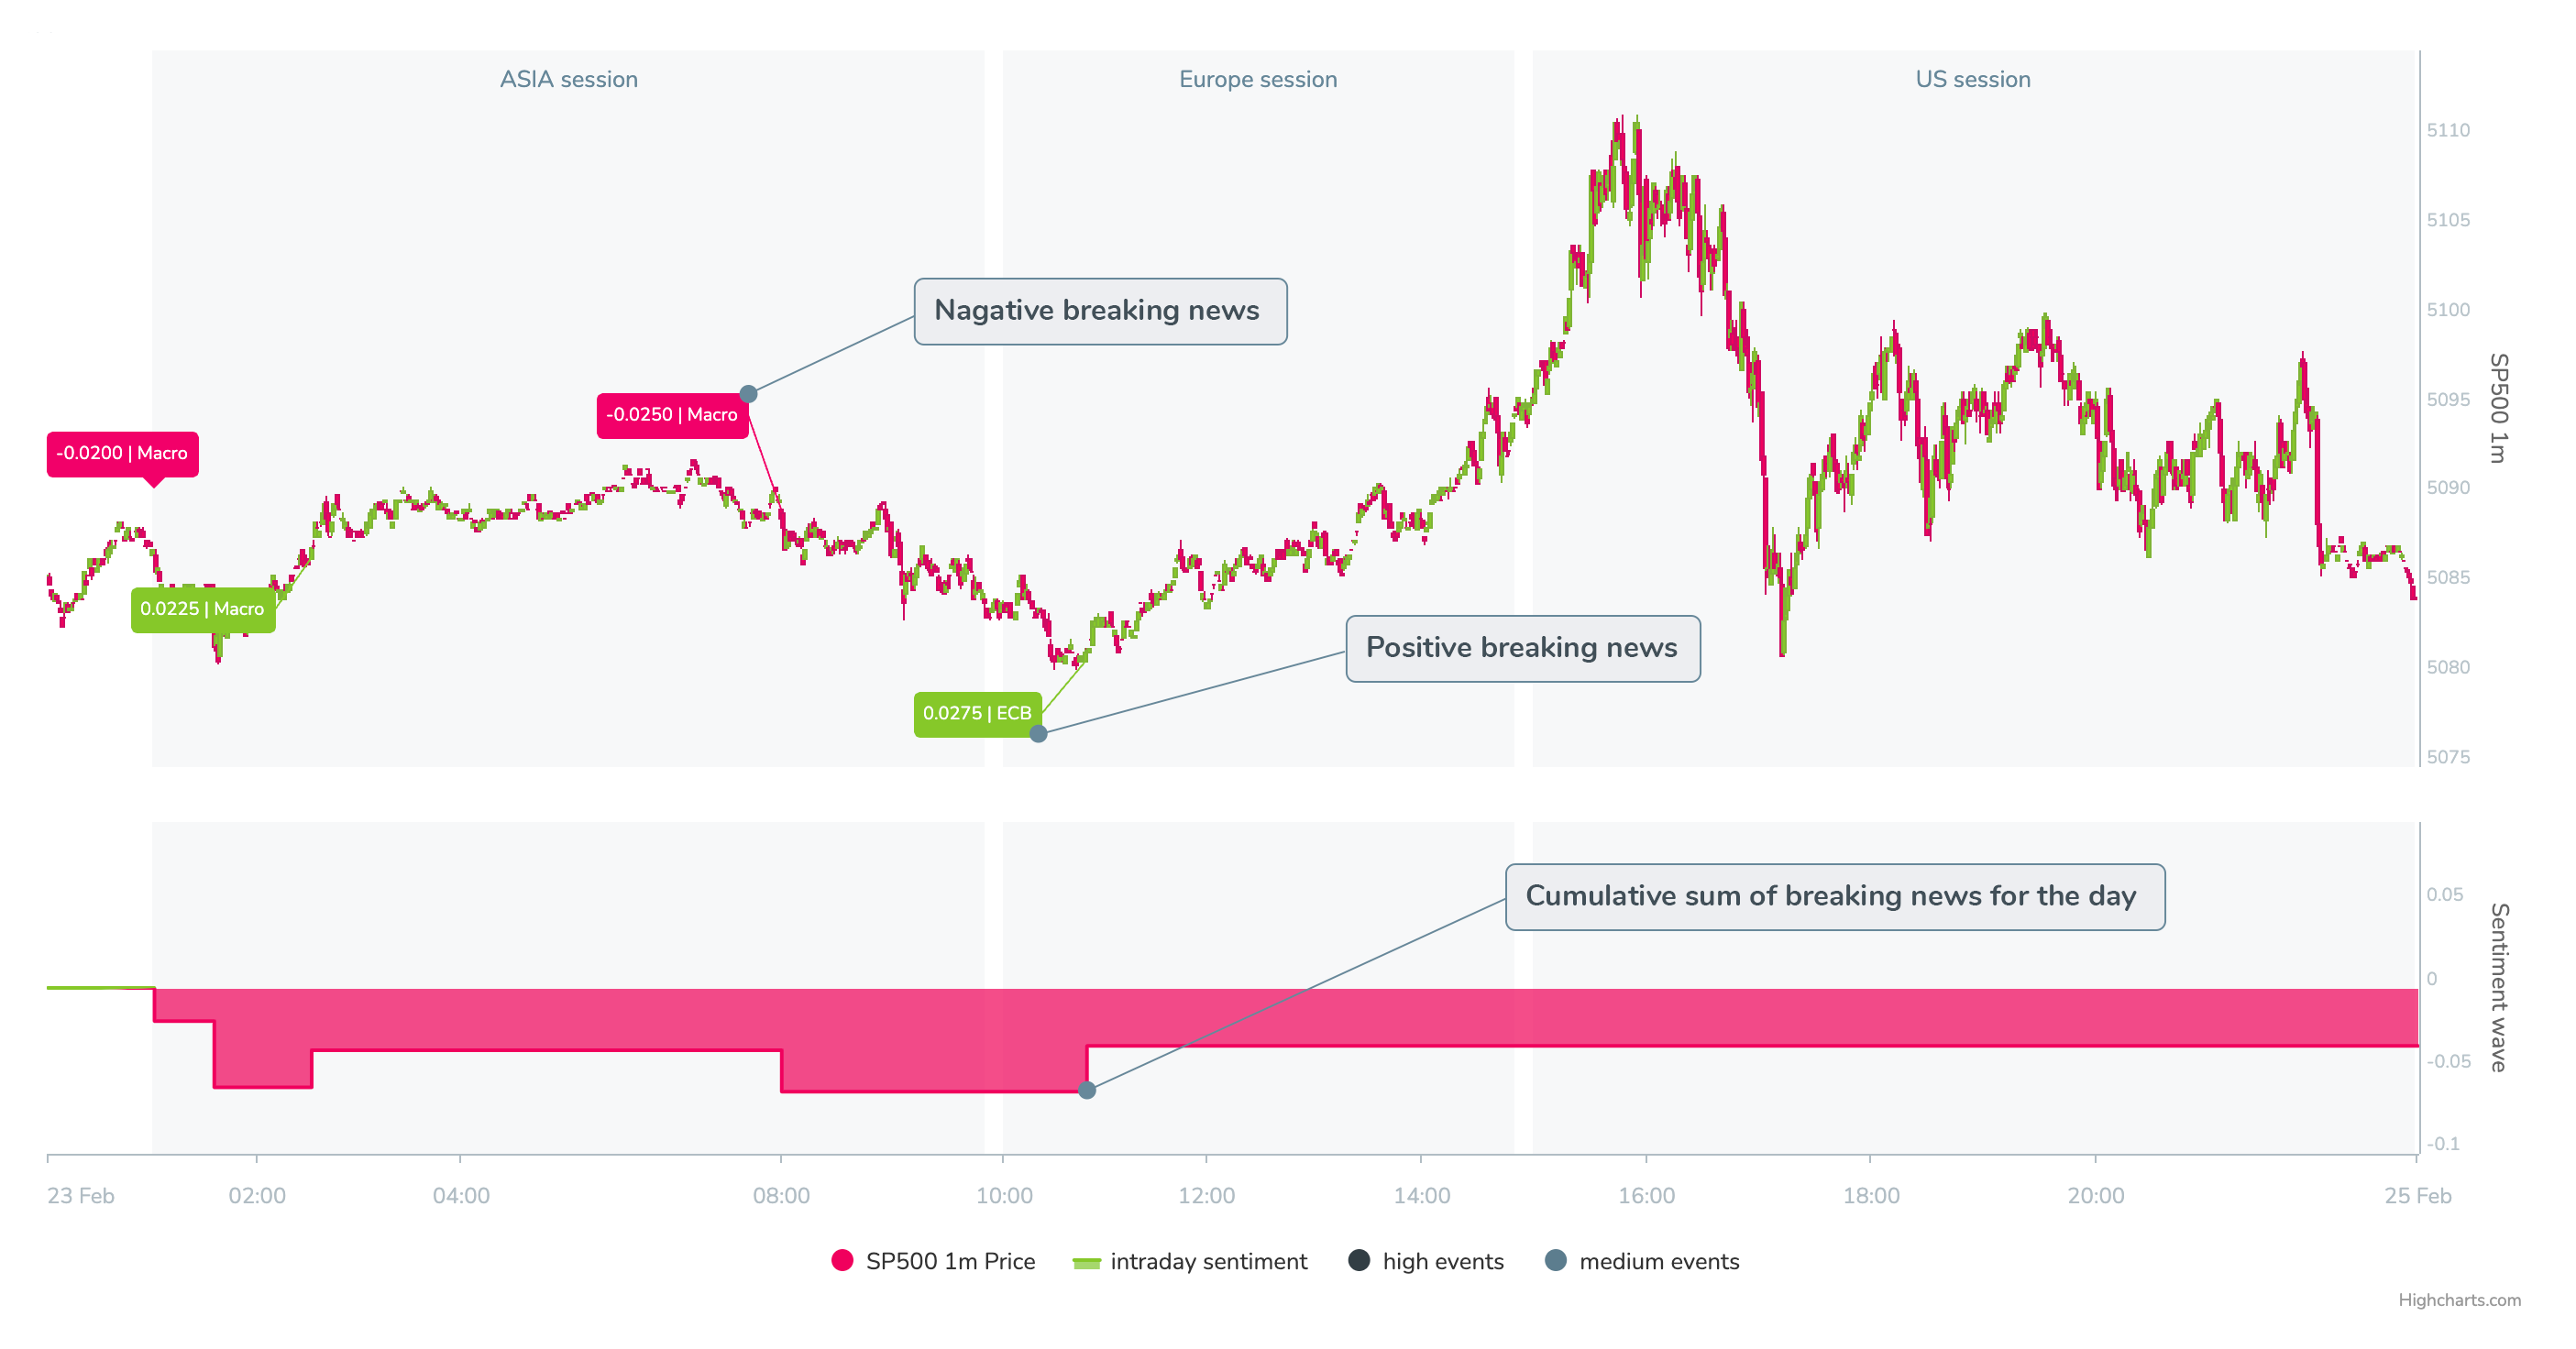
It is the sum of values of measured breaking news for the respective day. It may look like this:
In the chart, you can track the development of measurements of breaking news within a respective day. The chart shows its development throughout the day – the chart of the measured sentiment for the current day (sum of news values) with the SP500 candlestick chart above. All breaking news values within the respective day are automatically counted into the overall long-term sentiment and here we can observe how it develops within the day (each week starts from 0).
How to read intraday sentiment?
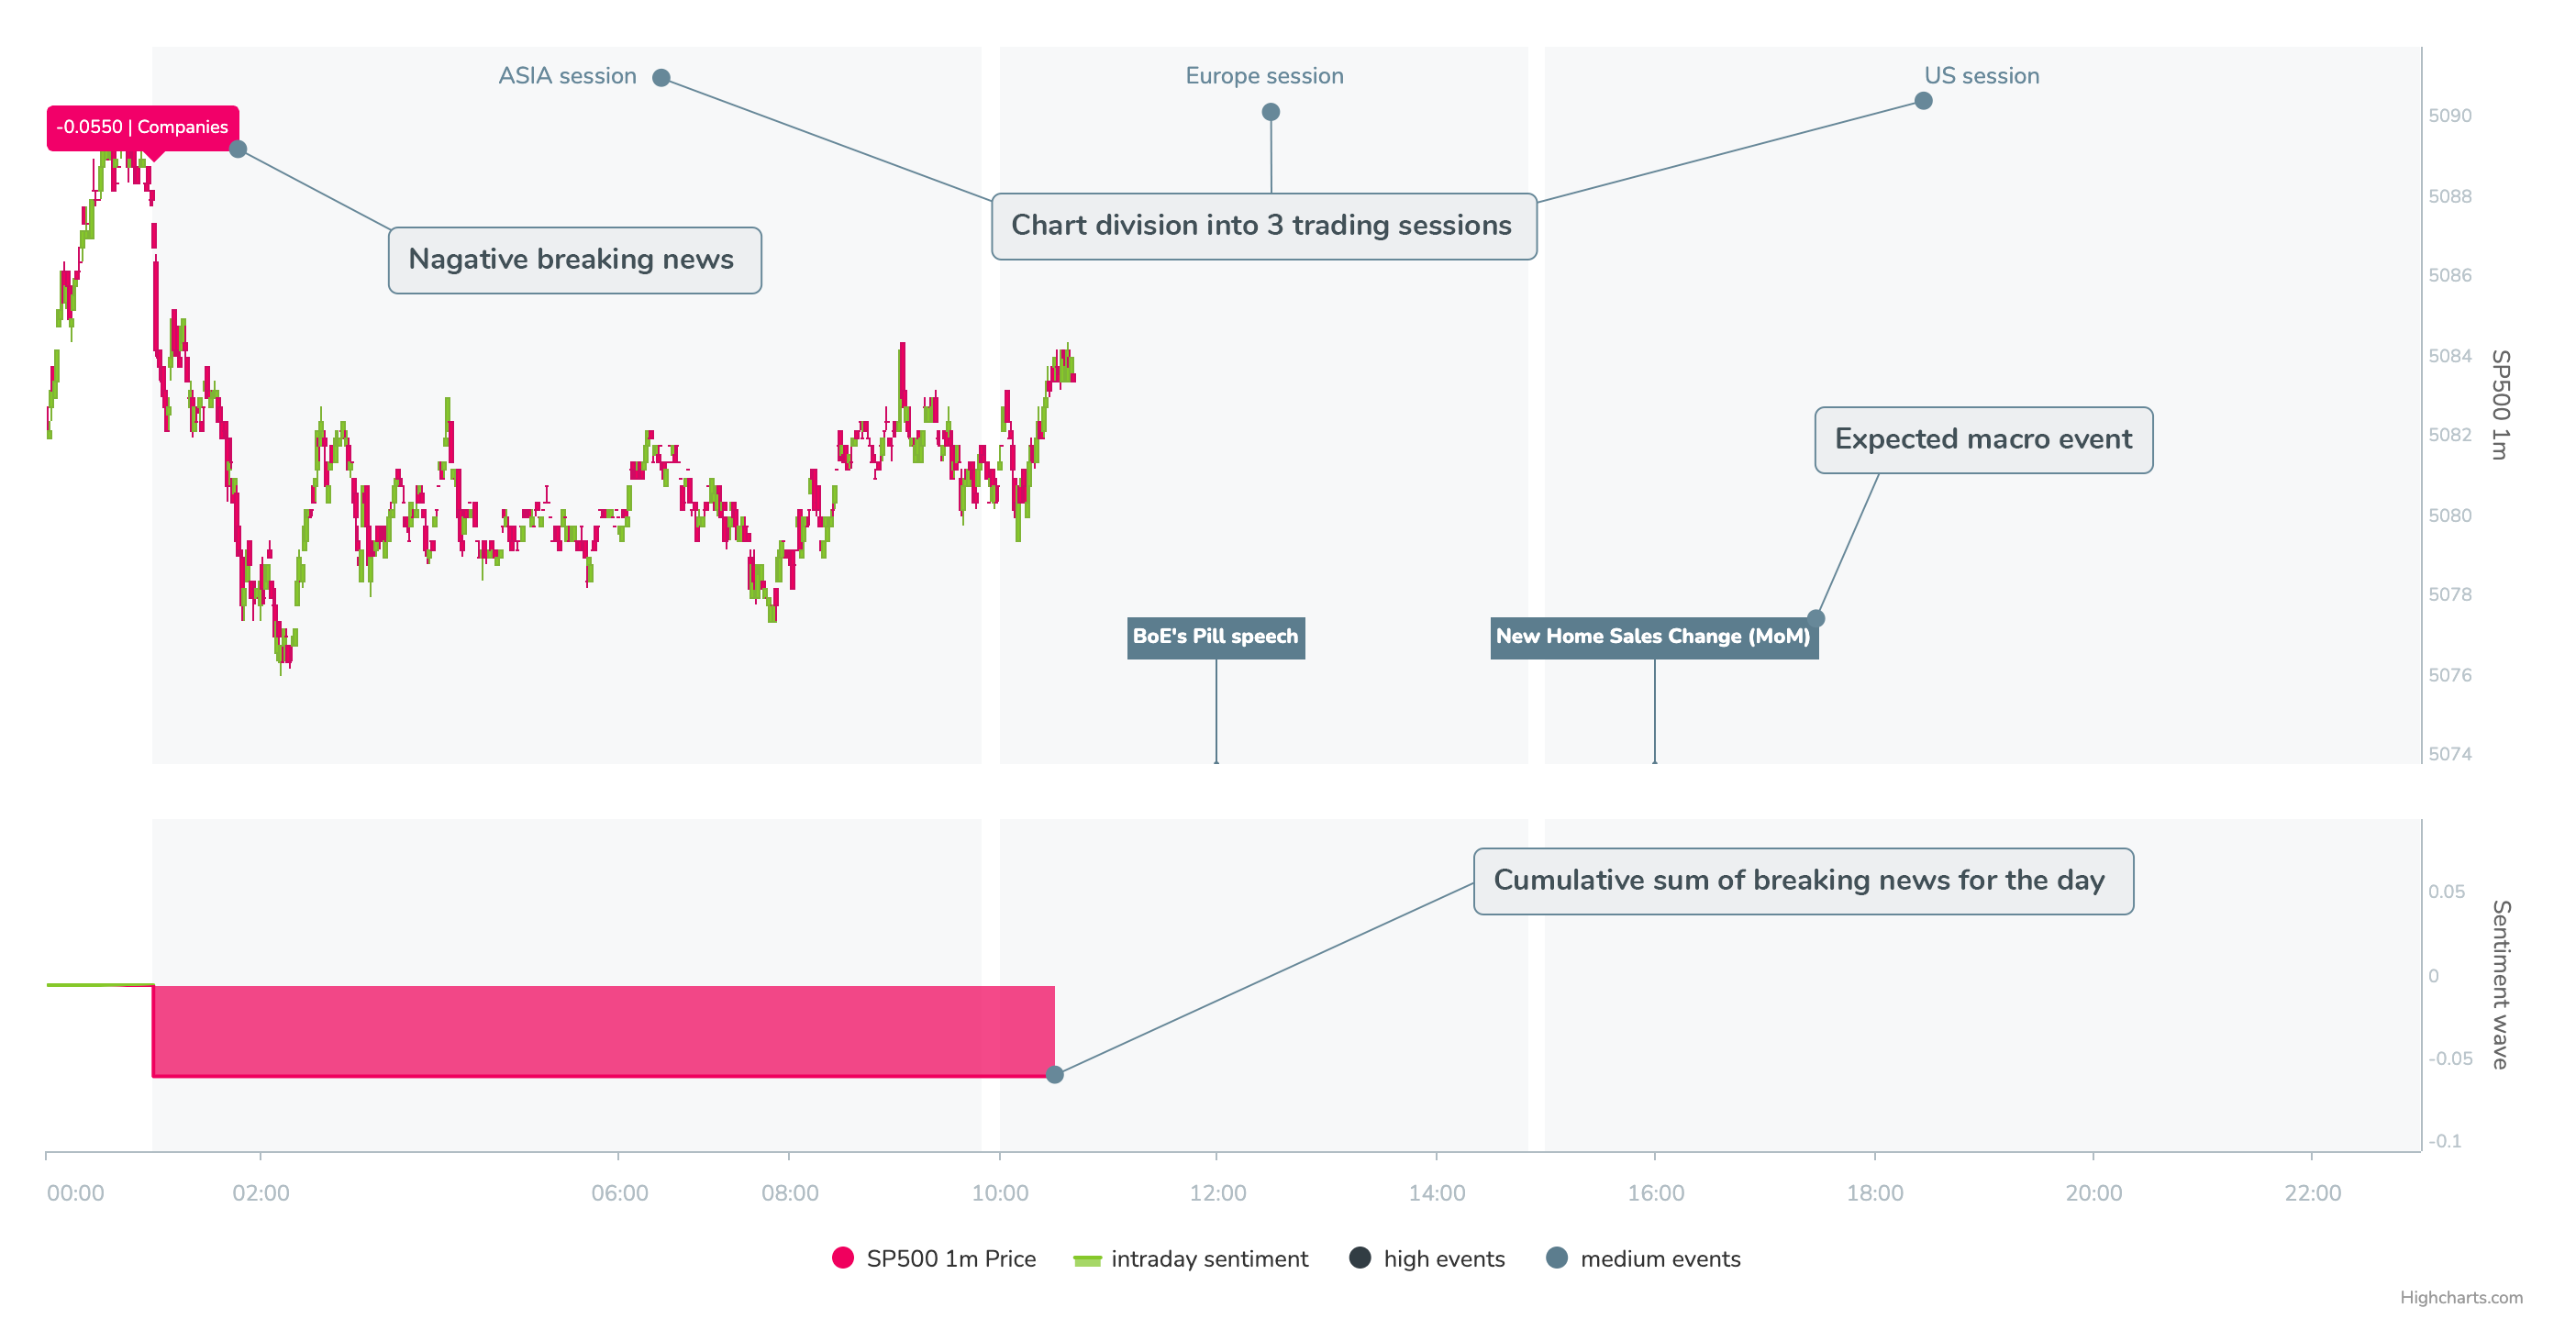
In the image above, you can see the development of measurement within the respective day with an example of sideways trading. However, the view of this development retrospectively is more of a rear-view mirror. For us, this chart is always important at the beginning of or at some point during the respective trading day. Following the chart can serve as an example:
which is shownYou can see the interim development during the Asian and the beginning of the European session on the current trading day as well as and main future macro events that are likely to trigger market movements.
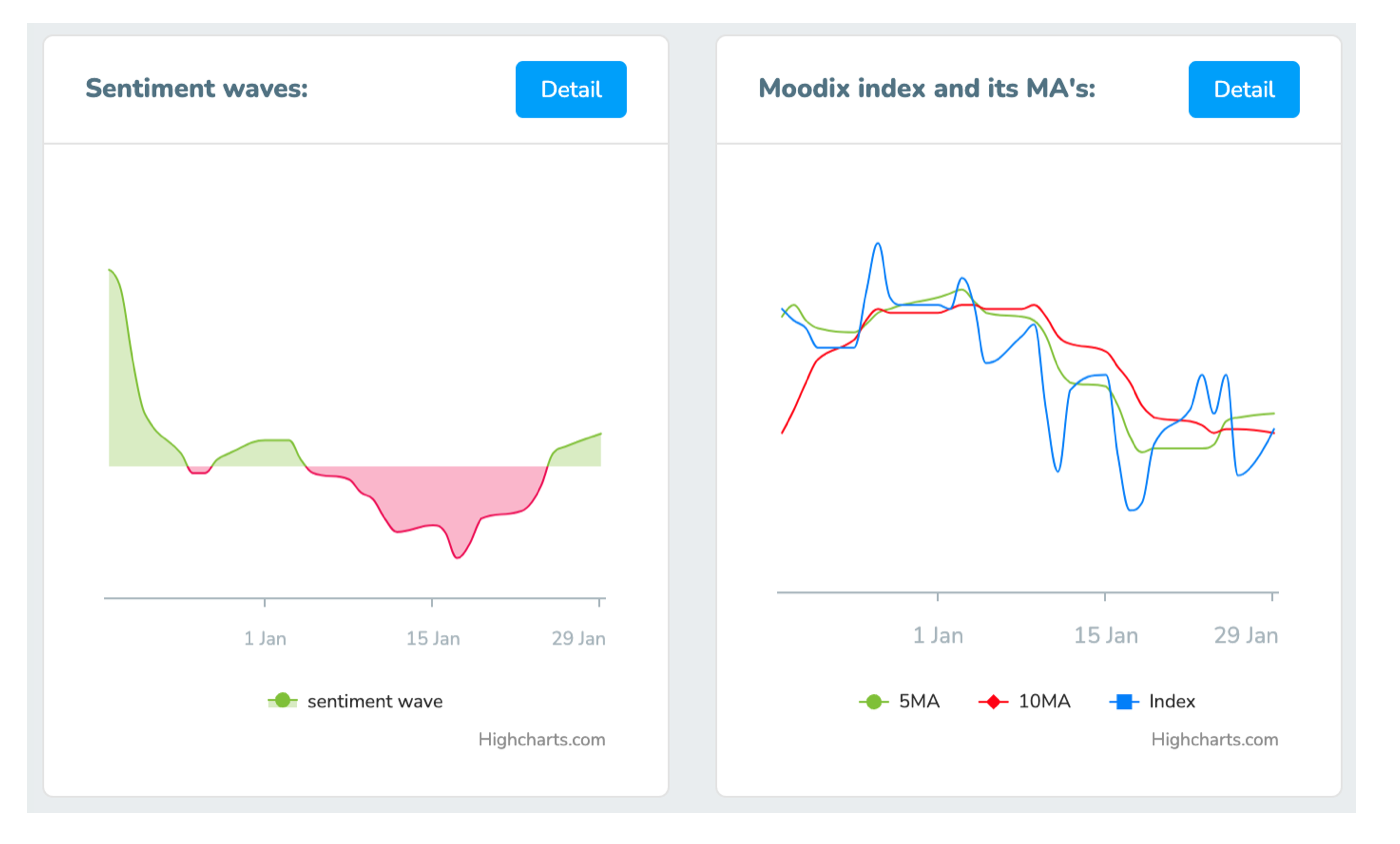
From the image, it can be concluded the day has started with sideways trading (very common during the Asian session) and there was a slight deterioration before the opening of the European markets (so far there was one piece of breaking news). At the same time, we know that the state of moodix sentiment is positive as RiskOn is starting and looks like the following:
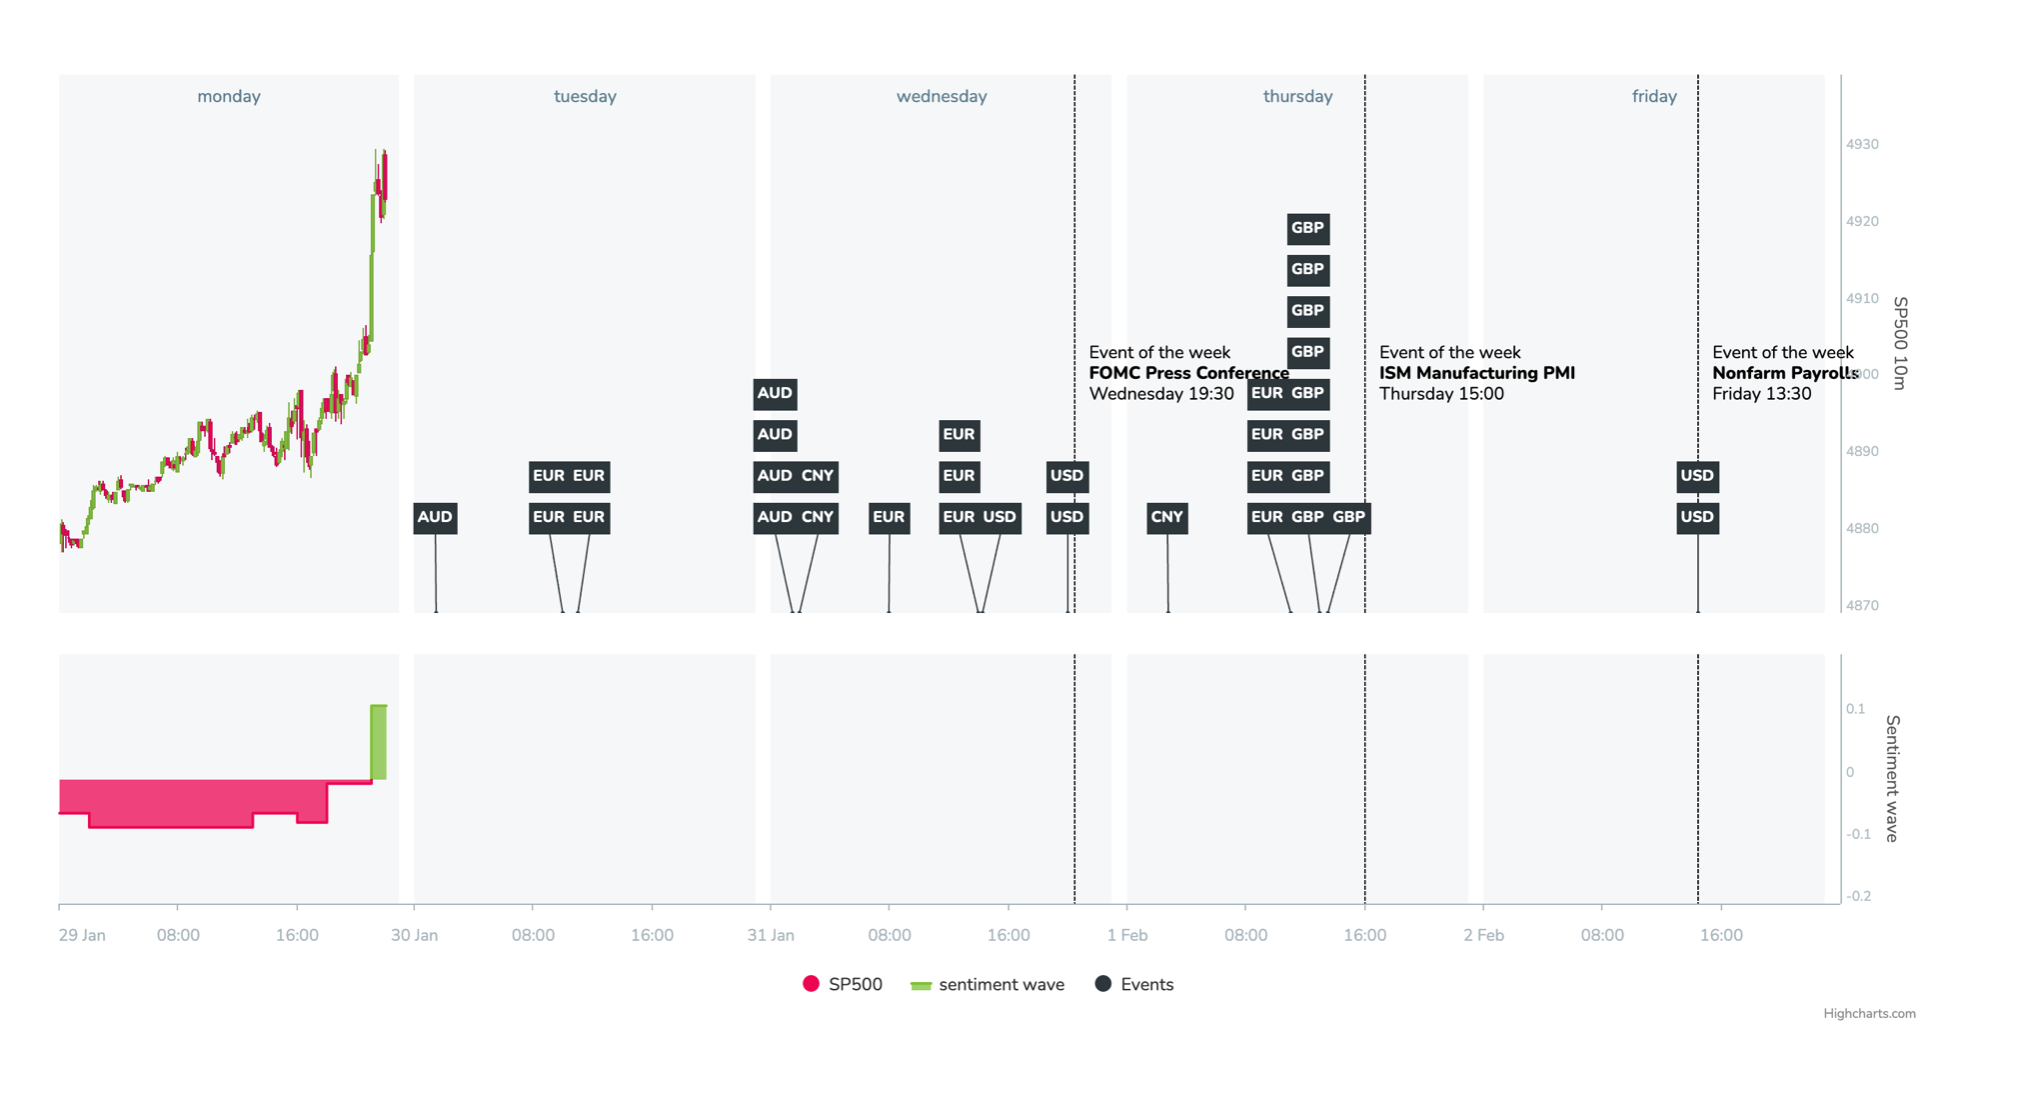
To get as accurate a picture as possible, we should also look at the development of weekly sentiment. We are usually mainly focused on the previous day. If it’s Monday, we advise people not to trade at all. The absence of any knowledge of development and context from the previous day (Friday of the previous week cannot be taken as such) is just one of the reasons why waiting till Tuesday is strongly preferable as the lack of market moving mews creates the risk of “stepping on the wrong foot” which is not negligible. Developments of the previous day from the perspective of the weekly chart looks positive (strong increase):
It’s important to note that when looking at the weekly development of sentiment, we don’t just look at the previous day. If it’s, for example, Thursday or Friday, we always look at the overall development of the week and the previous day as a sort of a weekly pivot. By looking at the previous day and on the accumulation of weekly sentiment, we understand what the market has already absorbed, what is putting it under pressure or, conversely, what “cheers” it up.
Therefore, given the setting of moodix sentiment and all its parameters, the intraday trader will be looking for long signals in their strategy on the short-term time frame. In this specific example, both because the very nature of positive long-term sentiment and from the perspective that a positive RiskOn wave has just started, it tends to last longer in most cases. Although we cannot be 100% sure how long such a positive RiskOn wave will last or how strong will it become, we know how the market sentiment is tuned and the direction it is most likely to go. Simply put, we add a substantially higher probability of success to your entry.
Signal confirmation
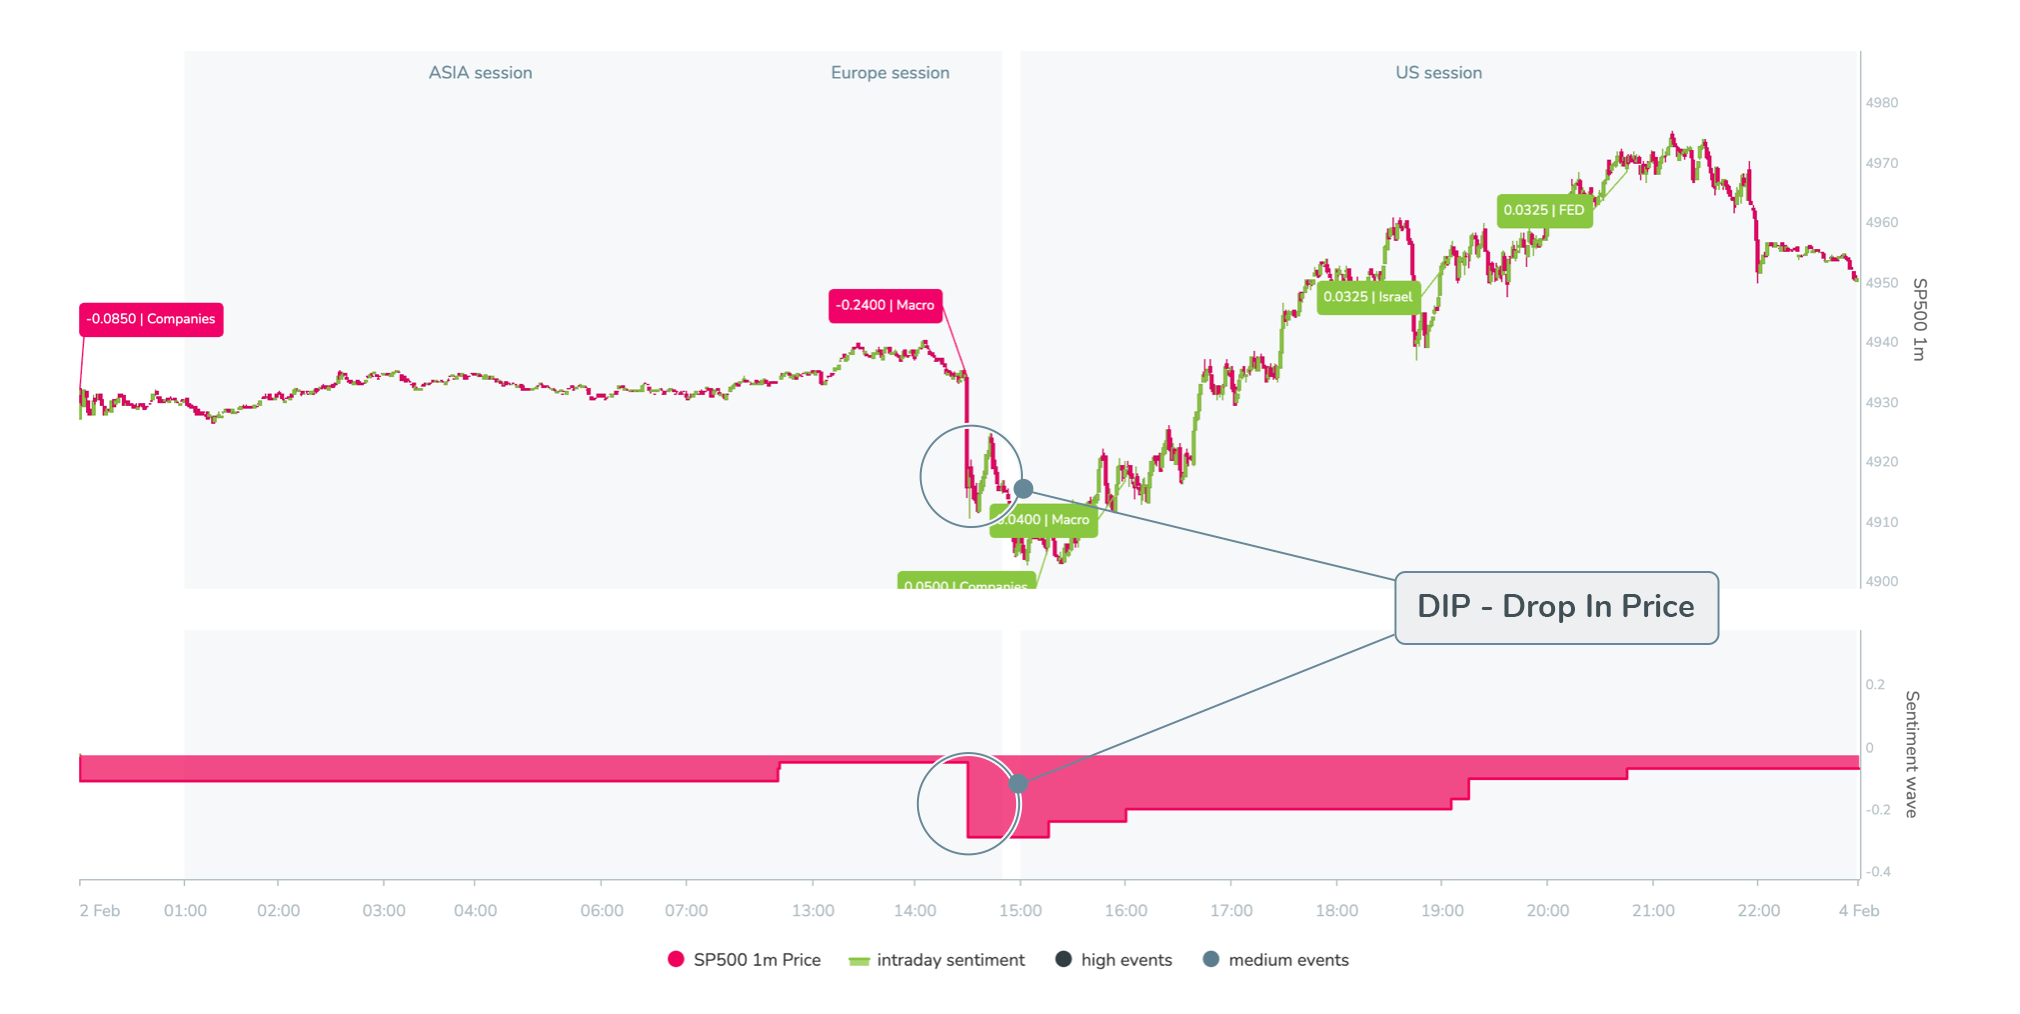
In the above-described market sentiment environment, the capital allocation would probably wait, for example, for a DIP (momentary counter-trend movement). This market movement is usually caused by some news (geopolitical or corporate) or a by macroeconomic event.
In the following image, you can see a nice opportunity that arose after the release of US ADP. If we know that moodix sentiment is RiskOn and we see a strong increase in weekly sentiment the previous day, the market is likely set up to go higher. Therefore, in the example shown below, we see a relatively strong opportunity and exemplary confirmation of the signal for capital allocation.
Signal rejection
The opposite situation also commonly occurs. Just imagine that in the described exemplary situation we would have a negative RiskOff sentiment environment. Weekly sentiment would also be negative (countertrend). In this case, the same capital allocation would not receive a validation confirmation. The moodix system would definitely suggest that there is a higher chance the market moves lower and from the perspective of moodix measurement, the signal would have been rejected.
